Immigrants from Bulgaria vs Swedish 4th Grade

COMPARE

Immigrants from Bulgaria
Race
Ancestry
AfghanAfricanAlaska NativeAlaskan AthabascanAlbanianAleutAlsatianAmericanApacheArabArapahoArgentineanArmenianAssyrian/Chaldean/SyriacAustralianAustrianBahamianBangladeshiBarbadianBasqueBelgianBelizeanBermudanBhutaneseBlackfeetBolivianBrazilianBritishBritish West IndianBulgarianBurmeseCajunCambodianCanadianCape VerdeanCarpatho RusynCelticCentral AmericanCentral American IndianCherokeeCheyenneChickasawChileanChineseChippewaChoctawColombianColvilleComancheCosta RicanCreeCreekCroatianCrowCubanCypriotCzechCzechoslovakianDanishDelawareDominicanDutchDutch West IndianEastern EuropeanEcuadorianEgyptianEnglishEstonianEthiopianEuropeanFijianFilipinoFinnishFrenchFrench American IndianFrench CanadianGermanGerman RussianGhanaianGreekGuamanian/ChamorroGuatemalanGuyaneseHaitianHmongHonduranHopiHoumaHungarianIcelanderIndian (Asian)IndonesianInupiatIranianIraqiIrishIroquoisIsraeliItalianJamaicanJapaneseJordanianKenyanKiowaKoreanLaotianLatvianLebaneseLiberianLithuanianLumbeeLuxembourgerMacedonianMalaysianMalteseMarshalleseMenomineeMexicanMexican American IndianMongolianMoroccanNative HawaiianNavajoNepaleseNew ZealanderNicaraguanNigerianNorthern EuropeanNorwegianOkinawanOsageOttawaPaiutePakistaniPalestinianPanamanianParaguayanPennsylvania GermanPeruvianPimaPolishPortuguesePotawatomiPuebloPuerto RicanPuget Sound SalishRomanianRussianSalvadoranSamoanScandinavianScotch-IrishScottishSeminoleSenegaleseSerbianShoshoneSierra LeoneanSiouxSlavicSlovakSloveneSomaliSouth AfricanSouth AmericanSouth American IndianSoviet UnionSpaniardSpanishSpanish AmericanSpanish American IndianSri LankanSubsaharan AfricanSudaneseSwissSyrianTaiwaneseThaiTlingit-HaidaTohono O'OdhamTonganTrinidadian and TobagonianTsimshianTurkishU.S. Virgin IslanderUgandanUkrainianUruguayanUteVenezuelanVietnameseWelshWest IndianYakamaYaquiYugoslavianYumanYup'ikZimbabwean
Immigration
NonimmigrantsImmigrantsAfghanistanAfricaAlbaniaArgentinaArmeniaAsiaAustraliaAustriaBahamasBangladeshBarbadosBelarusBelgiumBelizeBoliviaBosnia and HerzegovinaBrazilBulgariaBurma/MyanmarCabo VerdeCambodiaCameroonCanadaCaribbeanCentral AmericaChileChinaColombiaCongoCosta RicaCroatiaCubaCzechoslovakiaDenmarkDominicaDominican RepublicEastern AfricaEastern AsiaEastern EuropeEcuadorEgyptEl SalvadorEnglandEritreaEthiopiaEuropeFijiFranceGermanyGhanaGreeceGrenadaGuatemalaGuyanaHaitiHondurasHong KongHungaryIndiaIndonesiaIranIraqIrelandIsraelItalyJamaicaJapanJordanKazakhstanKenyaKoreaKuwaitLaosLatin AmericaLatviaLebanonLiberiaLithuaniaMalaysiaMexicoMicronesiaMiddle AfricaMoldovaMoroccoNepalNetherlandsNicaraguaNigeriaNorth AmericaNorth MacedoniaNorthern AfricaNorthern EuropeNorwayOceaniaPakistanPanamaPeruPhilippinesPolandPortugalRomaniaRussiaSaudi ArabiaScotlandSenegalSerbiaSierra LeoneSingaporeSomaliaSouth AfricaSouth AmericaSouth Central AsiaSouth Eastern AsiaSouthern EuropeSpainSri LankaSt. Vincent and the GrenadinesSudanSwedenSwitzerlandSyriaTaiwanThailandTrinidad and TobagoTurkeyUgandaUkraineUruguayUzbekistanVenezuelaVietnamWest IndiesWestern AfricaWestern AsiaWestern EuropeYemenZaireZimbabweAzores
Swedish
Race
Ancestry
AfghanAfricanAlaska NativeAlaskan AthabascanAlbanianAleutAlsatianAmericanApacheArabArapahoArgentineanArmenianAssyrian/Chaldean/SyriacAustralianAustrianBahamianBangladeshiBarbadianBasqueBelgianBelizeanBermudanBhutaneseBlackfeetBolivianBrazilianBritishBritish West IndianBulgarianBurmeseCajunCambodianCanadianCape VerdeanCarpatho RusynCelticCentral AmericanCentral American IndianCherokeeCheyenneChickasawChileanChineseChippewaChoctawColombianColvilleComancheCosta RicanCreeCreekCroatianCrowCubanCypriotCzechCzechoslovakianDanishDelawareDominicanDutchDutch West IndianEastern EuropeanEcuadorianEgyptianEnglishEstonianEthiopianEuropeanFijianFilipinoFinnishFrenchFrench American IndianFrench CanadianGermanGerman RussianGhanaianGreekGuamanian/ChamorroGuatemalanGuyaneseHaitianHmongHonduranHopiHoumaHungarianIcelanderIndian (Asian)IndonesianInupiatIranianIraqiIrishIroquoisIsraeliItalianJamaicanJapaneseJordanianKenyanKiowaKoreanLaotianLatvianLebaneseLiberianLithuanianLumbeeLuxembourgerMacedonianMalaysianMalteseMarshalleseMenomineeMexicanMexican American IndianMongolianMoroccanNative HawaiianNavajoNepaleseNew ZealanderNicaraguanNigerianNorthern EuropeanNorwegianOkinawanOsageOttawaPaiutePakistaniPalestinianPanamanianParaguayanPennsylvania GermanPeruvianPimaPolishPortuguesePotawatomiPuebloPuerto RicanPuget Sound SalishRomanianRussianSalvadoranSamoanScandinavianScotch-IrishScottishSeminoleSenegaleseSerbianShoshoneSierra LeoneanSiouxSlavicSlovakSloveneSomaliSouth AfricanSouth AmericanSouth American IndianSoviet UnionSpaniardSpanishSpanish AmericanSpanish American IndianSri LankanSubsaharan AfricanSudaneseSwedishSwissSyrianTaiwaneseThaiTlingit-HaidaTohono O'OdhamTonganTrinidadian and TobagonianTsimshianTurkishU.S. Virgin IslanderUgandanUkrainianUruguayanUteVenezuelanVietnameseWelshWest IndianYakamaYaquiYugoslavianYumanYup'ikZimbabwean
Immigration
NonimmigrantsImmigrantsAfghanistanAfricaAlbaniaArgentinaArmeniaAsiaAustraliaAustriaBahamasBangladeshBarbadosBelarusBelgiumBelizeBoliviaBosnia and HerzegovinaBrazilBurma/MyanmarCabo VerdeCambodiaCameroonCanadaCaribbeanCentral AmericaChileChinaColombiaCongoCosta RicaCroatiaCubaCzechoslovakiaDenmarkDominicaDominican RepublicEastern AfricaEastern AsiaEastern EuropeEcuadorEgyptEl SalvadorEnglandEritreaEthiopiaEuropeFijiFranceGermanyGhanaGreeceGrenadaGuatemalaGuyanaHaitiHondurasHong KongHungaryIndiaIndonesiaIranIraqIrelandIsraelItalyJamaicaJapanJordanKazakhstanKenyaKoreaKuwaitLaosLatin AmericaLatviaLebanonLiberiaLithuaniaMalaysiaMexicoMicronesiaMiddle AfricaMoldovaMoroccoNepalNetherlandsNicaraguaNigeriaNorth AmericaNorth MacedoniaNorthern AfricaNorthern EuropeNorwayOceaniaPakistanPanamaPeruPhilippinesPolandPortugalRomaniaRussiaSaudi ArabiaScotlandSenegalSerbiaSierra LeoneSingaporeSomaliaSouth AfricaSouth AmericaSouth Central AsiaSouth Eastern AsiaSouthern EuropeSpainSri LankaSt. Vincent and the GrenadinesSudanSwedenSwitzerlandSyriaTaiwanThailandTrinidad and TobagoTurkeyUgandaUkraineUruguayUzbekistanVenezuelaVietnamWest IndiesWestern AfricaWestern AsiaWestern EuropeYemenZaireZimbabweAzores
4th Grade
Income
Poverty
Unemployment
Labor Participation
Family Structure
Vehicle Availability
Education Level
Disability

4th Grade Comparison

Immigrants from Bulgaria

Swedes

Exceptional
Exceptional
97.7%
4TH GRADE
91.3/ 100
METRIC RATING
129th/ 347
METRIC RANK
98.4%
4TH GRADE
100.0/ 100
METRIC RATING
13th/ 347
METRIC RANK

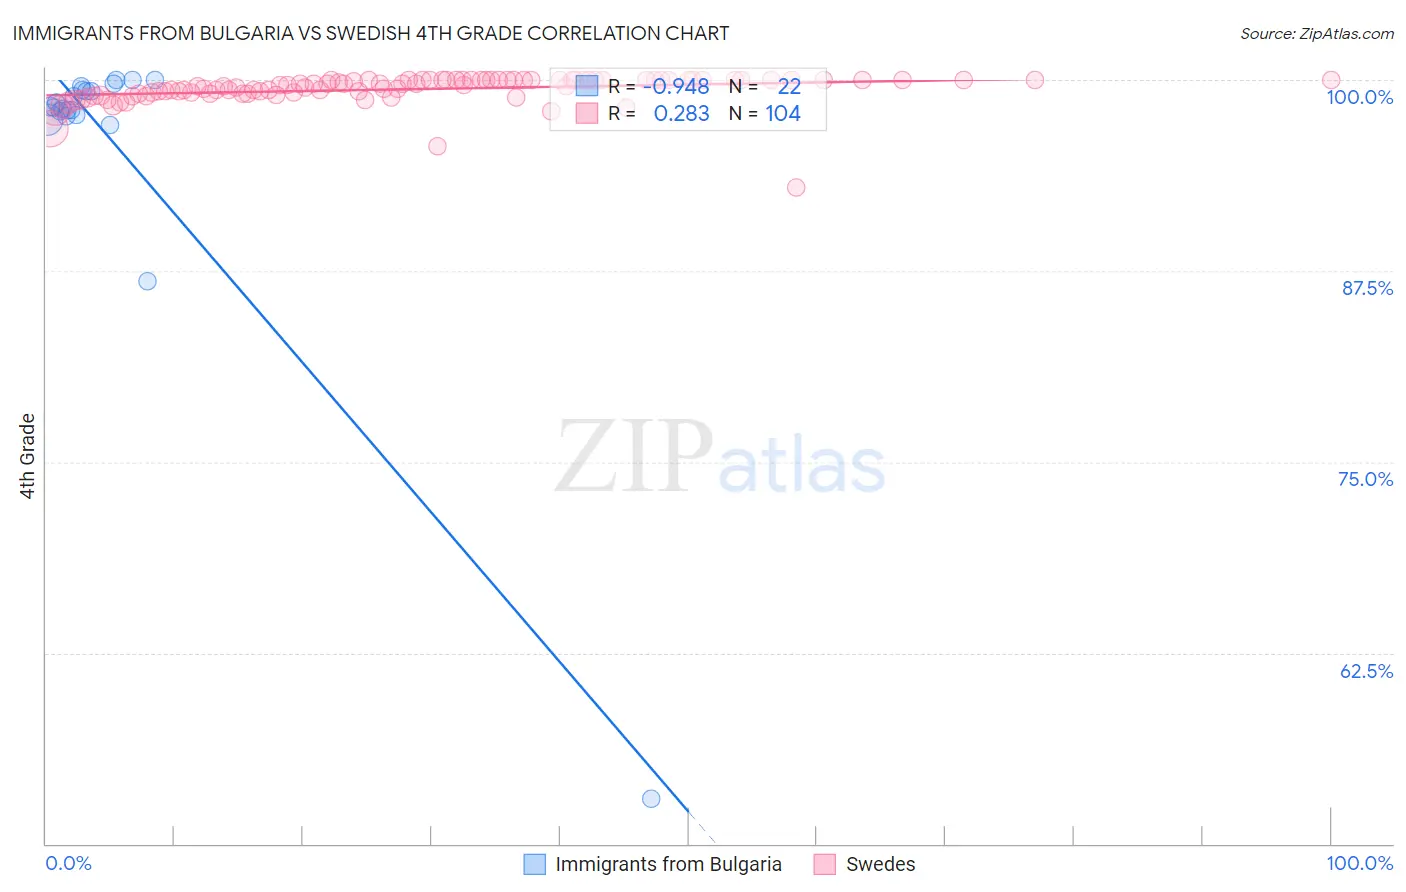
Immigrants from Bulgaria vs Swedish 4th Grade Correlation Chart

The statistical analysis conducted on geographies consisting of 172,552,181 people shows a near-perfect negative correlation between the proportion of Immigrants from Bulgaria and percentage of population with at least 4th grade education in the United States with a correlation coefficient (R) of -0.948 and weighted average of 97.7%. Similarly, the statistical analysis conducted on geographies consisting of 539,231,492 people shows a weak positive correlation between the proportion of Swedes and percentage of population with at least 4th grade education in the United States with a correlation coefficient (R) of 0.283 and weighted average of 98.4%, a difference of 0.69%.
Immigrants from Bulgaria vs Swedish 4th Grade

4th Grade Correlation Summary

MeasurementImmigrants from BulgariaSwedish
Minimum52.9%92.9%
Maximum100.0%100.0%
Range47.1%7.1%
Mean96.0%99.4%
Median98.2%99.7%
Interquartile 25% (IQ1)97.7%99.1%
Interquartile 75% (IQ3)99.4%100.0%
Interquartile Range (IQR)1.7%0.87%
Standard Deviation (Sample)10.0%0.95%
Standard Deviation (Population)9.8%0.95%

Similar Demographics by 4th Grade

Demographics Similar to Immigrants from Bulgaria by 4th Grade

In terms of 4th grade, the demographic groups most similar to Immigrants from Bulgaria are Immigrants from Europe (97.8%, a difference of 0.010%), Colville (97.7%, a difference of 0.010%), Pima (97.7%, a difference of 0.010%), Immigrants from Romania (97.7%, a difference of 0.010%), and Immigrants from Serbia (97.8%, a difference of 0.020%).
DemographicsRating | Rank4th Grade
Immigrants | Japan
94.1
/100
|
#122
Exceptional
97.8%
Immigrants | Zimbabwe
93.9
/100
|
#123
Exceptional
97.8%
Spanish
93.7
/100
|
#124
Exceptional
97.8%
Immigrants | Serbia
92.6
/100
|
#125
Exceptional
97.8%
Immigrants | Europe
92.5
/100
|
#126
Exceptional
97.8%
Colville
92.3
/100
|
#127
Exceptional
97.7%
Pima
92.0
/100
|
#128
Exceptional
97.7%
Immigrants | Bulgaria
91.3
/100
|
#129
Exceptional
97.7%
Immigrants | Romania
90.6
/100
|
#130
Exceptional
97.7%
Immigrants | Kuwait
89.7
/100
|
#131
Excellent
97.7%
Immigrants | Hungary
89.3
/100
|
#132
Excellent
97.7%
Hmong
88.2
/100
|
#133
Excellent
97.7%
Palestinians
88.1
/100
|
#134
Excellent
97.7%
Cambodians
87.8
/100
|
#135
Excellent
97.7%
Israelis
86.2
/100
|
#136
Excellent
97.7%

Demographics Similar to Swedes by 4th Grade

In terms of 4th grade, the demographic groups most similar to Swedes are English (98.4%, a difference of 0.0%), Tlingit-Haida (98.4%, a difference of 0.0%), Alaskan Athabascan (98.4%, a difference of 0.010%), Carpatho Rusyn (98.4%, a difference of 0.010%), and Slovene (98.4%, a difference of 0.030%).
DemographicsRating | Rank4th Grade
Norwegians
100.0
/100
|
#6
Exceptional
98.5%
Slovaks
100.0
/100
|
#7
Exceptional
98.5%
Germans
100.0
/100
|
#8
Exceptional
98.5%
Slovenes
100.0
/100
|
#9
Exceptional
98.4%
Alaskan Athabascans
100.0
/100
|
#10
Exceptional
98.4%
English
100.0
/100
|
#11
Exceptional
98.4%
Tlingit-Haida
100.0
/100
|
#12
Exceptional
98.4%
Swedes
100.0
/100
|
#13
Exceptional
98.4%
Carpatho Rusyns
100.0
/100
|
#14
Exceptional
98.4%
Dutch
100.0
/100
|
#15
Exceptional
98.4%
Scottish
100.0
/100
|
#16
Exceptional
98.4%
Pennsylvania Germans
100.0
/100
|
#17
Exceptional
98.4%
Poles
100.0
/100
|
#18
Exceptional
98.4%
Irish
100.0
/100
|
#19
Exceptional
98.4%
Alaska Natives
100.0
/100
|
#20
Exceptional
98.4%