Immigrants from Bulgaria vs Immigrants from Sweden 3rd Grade

COMPARE

Immigrants from Bulgaria
Race
Ancestry
AfghanAfricanAlaska NativeAlaskan AthabascanAlbanianAleutAlsatianAmericanApacheArabArapahoArgentineanArmenianAssyrian/Chaldean/SyriacAustralianAustrianBahamianBangladeshiBarbadianBasqueBelgianBelizeanBermudanBhutaneseBlackfeetBolivianBrazilianBritishBritish West IndianBulgarianBurmeseCajunCambodianCanadianCape VerdeanCarpatho RusynCelticCentral AmericanCentral American IndianCherokeeCheyenneChickasawChileanChineseChippewaChoctawColombianColvilleComancheCosta RicanCreeCreekCroatianCrowCubanCypriotCzechCzechoslovakianDanishDelawareDominicanDutchDutch West IndianEastern EuropeanEcuadorianEgyptianEnglishEstonianEthiopianEuropeanFijianFilipinoFinnishFrenchFrench American IndianFrench CanadianGermanGerman RussianGhanaianGreekGuamanian/ChamorroGuatemalanGuyaneseHaitianHmongHonduranHopiHoumaHungarianIcelanderIndian (Asian)IndonesianInupiatIranianIraqiIrishIroquoisIsraeliItalianJamaicanJapaneseJordanianKenyanKiowaKoreanLaotianLatvianLebaneseLiberianLithuanianLumbeeLuxembourgerMacedonianMalaysianMalteseMarshalleseMenomineeMexicanMexican American IndianMongolianMoroccanNative HawaiianNavajoNepaleseNew ZealanderNicaraguanNigerianNorthern EuropeanNorwegianOkinawanOsageOttawaPaiutePakistaniPalestinianPanamanianParaguayanPennsylvania GermanPeruvianPimaPolishPortuguesePotawatomiPuebloPuerto RicanPuget Sound SalishRomanianRussianSalvadoranSamoanScandinavianScotch-IrishScottishSeminoleSenegaleseSerbianShoshoneSierra LeoneanSiouxSlavicSlovakSloveneSomaliSouth AfricanSouth AmericanSouth American IndianSoviet UnionSpaniardSpanishSpanish AmericanSpanish American IndianSri LankanSubsaharan AfricanSudaneseSwedishSwissSyrianTaiwaneseThaiTlingit-HaidaTohono O'OdhamTonganTrinidadian and TobagonianTsimshianTurkishU.S. Virgin IslanderUgandanUkrainianUruguayanUteVenezuelanVietnameseWelshWest IndianYakamaYaquiYugoslavianYumanYup'ikZimbabwean
Immigration
NonimmigrantsImmigrantsAfghanistanAfricaAlbaniaArgentinaArmeniaAsiaAustraliaAustriaBahamasBangladeshBarbadosBelarusBelgiumBelizeBoliviaBosnia and HerzegovinaBrazilBulgariaBurma/MyanmarCabo VerdeCambodiaCameroonCanadaCaribbeanCentral AmericaChileChinaColombiaCongoCosta RicaCroatiaCubaCzechoslovakiaDenmarkDominicaDominican RepublicEastern AfricaEastern AsiaEastern EuropeEcuadorEgyptEl SalvadorEnglandEritreaEthiopiaEuropeFijiFranceGermanyGhanaGreeceGrenadaGuatemalaGuyanaHaitiHondurasHong KongHungaryIndiaIndonesiaIranIraqIrelandIsraelItalyJamaicaJapanJordanKazakhstanKenyaKoreaKuwaitLaosLatin AmericaLatviaLebanonLiberiaLithuaniaMalaysiaMexicoMicronesiaMiddle AfricaMoldovaMoroccoNepalNetherlandsNicaraguaNigeriaNorth AmericaNorth MacedoniaNorthern AfricaNorthern EuropeNorwayOceaniaPakistanPanamaPeruPhilippinesPolandPortugalRomaniaRussiaSaudi ArabiaScotlandSenegalSerbiaSierra LeoneSingaporeSomaliaSouth AfricaSouth AmericaSouth Central AsiaSouth Eastern AsiaSouthern EuropeSpainSri LankaSt. Vincent and the GrenadinesSudanSwitzerlandSyriaTaiwanThailandTrinidad and TobagoTurkeyUgandaUkraineUruguayUzbekistanVenezuelaVietnamWest IndiesWestern AfricaWestern AsiaWestern EuropeYemenZaireZimbabweAzores
Immigrants from Sweden
Race
Ancestry
AfghanAfricanAlaska NativeAlaskan AthabascanAlbanianAleutAlsatianAmericanApacheArabArapahoArgentineanArmenianAssyrian/Chaldean/SyriacAustralianAustrianBahamianBangladeshiBarbadianBasqueBelgianBelizeanBermudanBhutaneseBlackfeetBolivianBrazilianBritishBritish West IndianBulgarianBurmeseCajunCambodianCanadianCape VerdeanCarpatho RusynCelticCentral AmericanCentral American IndianCherokeeCheyenneChickasawChileanChineseChippewaChoctawColombianColvilleComancheCosta RicanCreeCreekCroatianCrowCubanCypriotCzechCzechoslovakianDanishDelawareDominicanDutchDutch West IndianEastern EuropeanEcuadorianEgyptianEnglishEstonianEthiopianEuropeanFijianFilipinoFinnishFrenchFrench American IndianFrench CanadianGermanGerman RussianGhanaianGreekGuamanian/ChamorroGuatemalanGuyaneseHaitianHmongHonduranHopiHoumaHungarianIcelanderIndian (Asian)IndonesianInupiatIranianIraqiIrishIroquoisIsraeliItalianJamaicanJapaneseJordanianKenyanKiowaKoreanLaotianLatvianLebaneseLiberianLithuanianLumbeeLuxembourgerMacedonianMalaysianMalteseMarshalleseMenomineeMexicanMexican American IndianMongolianMoroccanNative HawaiianNavajoNepaleseNew ZealanderNicaraguanNigerianNorthern EuropeanNorwegianOkinawanOsageOttawaPaiutePakistaniPalestinianPanamanianParaguayanPennsylvania GermanPeruvianPimaPolishPortuguesePotawatomiPuebloPuerto RicanPuget Sound SalishRomanianRussianSalvadoranSamoanScandinavianScotch-IrishScottishSeminoleSenegaleseSerbianShoshoneSierra LeoneanSiouxSlavicSlovakSloveneSomaliSouth AfricanSouth AmericanSouth American IndianSoviet UnionSpaniardSpanishSpanish AmericanSpanish American IndianSri LankanSubsaharan AfricanSudaneseSwedishSwissSyrianTaiwaneseThaiTlingit-HaidaTohono O'OdhamTonganTrinidadian and TobagonianTsimshianTurkishU.S. Virgin IslanderUgandanUkrainianUruguayanUteVenezuelanVietnameseWelshWest IndianYakamaYaquiYugoslavianYumanYup'ikZimbabwean
Immigration
NonimmigrantsImmigrantsAfghanistanAfricaAlbaniaArgentinaArmeniaAsiaAustraliaAustriaBahamasBangladeshBarbadosBelarusBelgiumBelizeBoliviaBosnia and HerzegovinaBrazilBurma/MyanmarCabo VerdeCambodiaCameroonCanadaCaribbeanCentral AmericaChileChinaColombiaCongoCosta RicaCroatiaCubaCzechoslovakiaDenmarkDominicaDominican RepublicEastern AfricaEastern AsiaEastern EuropeEcuadorEgyptEl SalvadorEnglandEritreaEthiopiaEuropeFijiFranceGermanyGhanaGreeceGrenadaGuatemalaGuyanaHaitiHondurasHong KongHungaryIndiaIndonesiaIranIraqIrelandIsraelItalyJamaicaJapanJordanKazakhstanKenyaKoreaKuwaitLaosLatin AmericaLatviaLebanonLiberiaLithuaniaMalaysiaMexicoMicronesiaMiddle AfricaMoldovaMoroccoNepalNetherlandsNicaraguaNigeriaNorth AmericaNorth MacedoniaNorthern AfricaNorthern EuropeNorwayOceaniaPakistanPanamaPeruPhilippinesPolandPortugalRomaniaRussiaSaudi ArabiaScotlandSenegalSerbiaSierra LeoneSingaporeSomaliaSouth AfricaSouth AmericaSouth Central AsiaSouth Eastern AsiaSouthern EuropeSpainSri LankaSt. Vincent and the GrenadinesSudanSwedenSwitzerlandSyriaTaiwanThailandTrinidad and TobagoTurkeyUgandaUkraineUruguayUzbekistanVenezuelaVietnamWest IndiesWestern AfricaWestern AsiaWestern EuropeYemenZaireZimbabweAzores
3rd Grade
Income
Poverty
Unemployment
Labor Participation
Family Structure
Vehicle Availability
Education Level
Disability

3rd Grade Comparison

Immigrants from Bulgaria

Immigrants from Sweden

Excellent
Exceptional
97.9%
3RD GRADE
89.1/ 100
METRIC RATING
131st/ 347
METRIC RANK
98.1%
3RD GRADE
98.9/ 100
METRIC RATING
84th/ 347
METRIC RANK

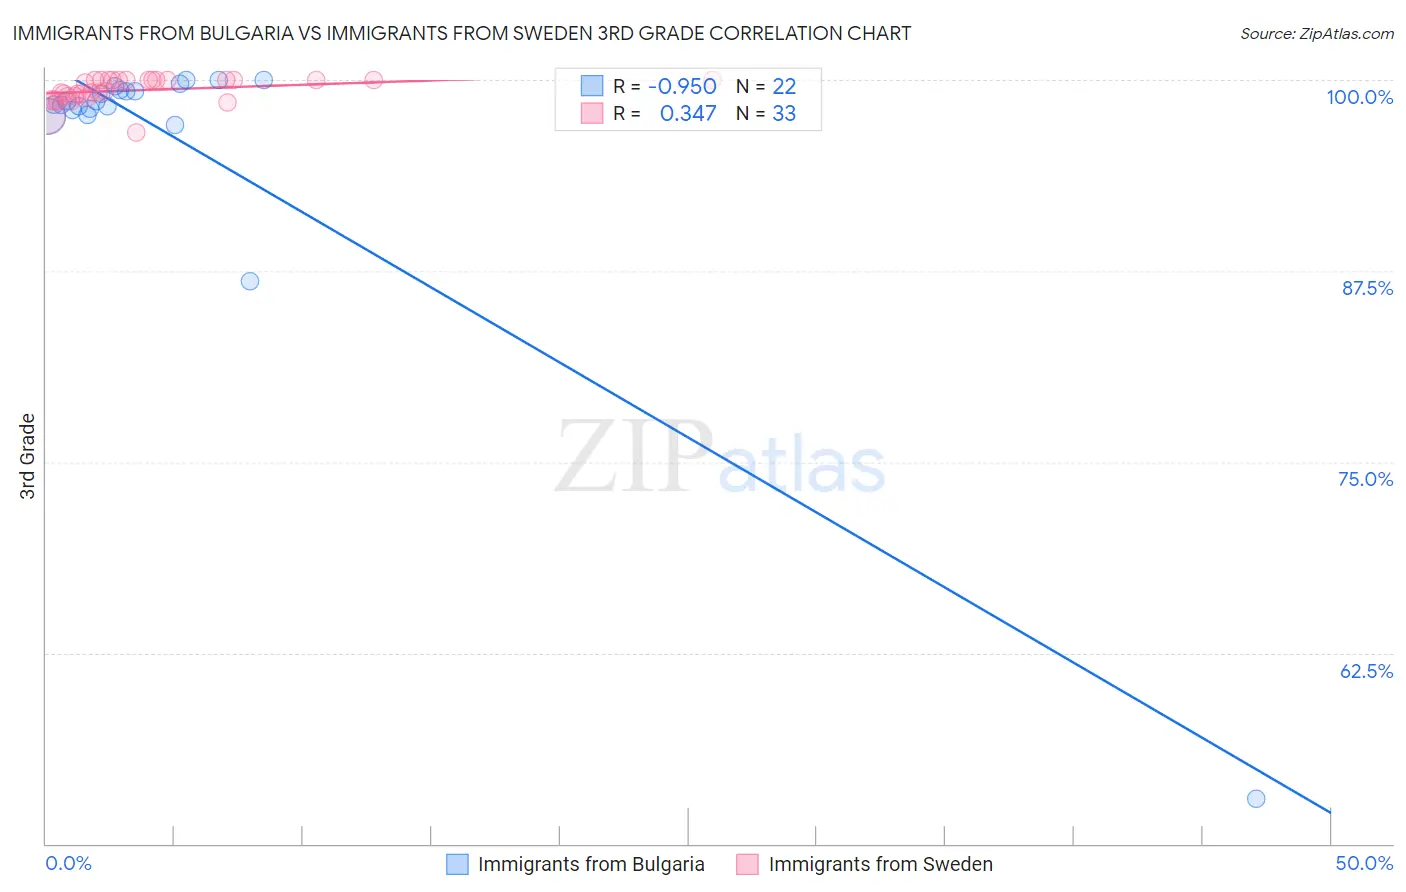
Immigrants from Bulgaria vs Immigrants from Sweden 3rd Grade Correlation Chart

The statistical analysis conducted on geographies consisting of 172,552,181 people shows a perfect negative correlation between the proportion of Immigrants from Bulgaria and percentage of population with at least 3rd grade education in the United States with a correlation coefficient (R) of -0.950 and weighted average of 97.9%. Similarly, the statistical analysis conducted on geographies consisting of 164,737,092 people shows a mild positive correlation between the proportion of Immigrants from Sweden and percentage of population with at least 3rd grade education in the United States with a correlation coefficient (R) of 0.347 and weighted average of 98.1%, a difference of 0.20%.
Immigrants from Bulgaria vs Immigrants from Sweden 3rd Grade

3rd Grade Correlation Summary

MeasurementImmigrants from BulgariaImmigrants from Sweden
Minimum52.9%96.5%
Maximum100.0%100.0%
Range47.1%3.5%
Mean96.1%99.3%
Median98.5%99.2%
Interquartile 25% (IQ1)98.1%98.9%
Interquartile 75% (IQ3)99.4%100.0%
Interquartile Range (IQR)1.3%1.1%
Standard Deviation (Sample)10.0%0.81%
Standard Deviation (Population)9.8%0.79%

Similar Demographics by 3rd Grade

Demographics Similar to Immigrants from Bulgaria by 3rd Grade

In terms of 3rd grade, the demographic groups most similar to Immigrants from Bulgaria are Immigrants from Hungary (97.9%, a difference of 0.0%), Immigrants from Kuwait (97.9%, a difference of 0.0%), Seminole (97.9%, a difference of 0.0%), Cambodian (97.9%, a difference of 0.010%), and Spaniard (97.9%, a difference of 0.010%).
DemographicsRating | Rank3rd Grade
Immigrants | Japan
93.7
/100
|
#124
Exceptional
98.0%
Immigrants | Saudi Arabia
93.5
/100
|
#125
Exceptional
98.0%
Immigrants | Zimbabwe
93.4
/100
|
#126
Exceptional
98.0%
Ute
93.2
/100
|
#127
Exceptional
98.0%
Colville
92.1
/100
|
#128
Exceptional
98.0%
Immigrants | Serbia
91.9
/100
|
#129
Exceptional
98.0%
Immigrants | Europe
91.2
/100
|
#130
Exceptional
98.0%
Immigrants | Bulgaria
89.1
/100
|
#131
Excellent
97.9%
Immigrants | Hungary
88.8
/100
|
#132
Excellent
97.9%
Immigrants | Kuwait
88.7
/100
|
#133
Excellent
97.9%
Seminole
88.7
/100
|
#134
Excellent
97.9%
Cambodians
88.1
/100
|
#135
Excellent
97.9%
Spaniards
87.9
/100
|
#136
Excellent
97.9%
Immigrants | Romania
87.9
/100
|
#137
Excellent
97.9%
Israelis
86.6
/100
|
#138
Excellent
97.9%

Demographics Similar to Immigrants from Sweden by 3rd Grade

In terms of 3rd grade, the demographic groups most similar to Immigrants from Sweden are Ukrainian (98.1%, a difference of 0.0%), Immigrants from Australia (98.1%, a difference of 0.0%), Potawatomi (98.1%, a difference of 0.0%), Immigrants from Denmark (98.1%, a difference of 0.0%), and Immigrants from India (98.1%, a difference of 0.0%).
DemographicsRating | Rank3rd Grade
Immigrants | Lithuania
99.2
/100
|
#77
Exceptional
98.2%
Osage
99.2
/100
|
#78
Exceptional
98.2%
Immigrants | Belgium
99.1
/100
|
#79
Exceptional
98.1%
Macedonians
99.1
/100
|
#80
Exceptional
98.1%
Icelanders
99.1
/100
|
#81
Exceptional
98.1%
Shoshone
99.0
/100
|
#82
Exceptional
98.1%
Ukrainians
98.9
/100
|
#83
Exceptional
98.1%
Immigrants | Sweden
98.9
/100
|
#84
Exceptional
98.1%
Immigrants | Australia
98.9
/100
|
#85
Exceptional
98.1%
Potawatomi
98.9
/100
|
#86
Exceptional
98.1%
Immigrants | Denmark
98.8
/100
|
#87
Exceptional
98.1%
Immigrants | India
98.8
/100
|
#88
Exceptional
98.1%
Delaware
98.8
/100
|
#89
Exceptional
98.1%
Zimbabweans
98.8
/100
|
#90
Exceptional
98.1%
Hopi
98.7
/100
|
#91
Exceptional
98.1%