Immigrants from Bulgaria vs Guyanese 2nd Grade

COMPARE

Immigrants from Bulgaria
Race
Ancestry
AfghanAfricanAlaska NativeAlaskan AthabascanAlbanianAleutAlsatianAmericanApacheArabArapahoArgentineanArmenianAssyrian/Chaldean/SyriacAustralianAustrianBahamianBangladeshiBarbadianBasqueBelgianBelizeanBermudanBhutaneseBlackfeetBolivianBrazilianBritishBritish West IndianBulgarianBurmeseCajunCambodianCanadianCape VerdeanCarpatho RusynCelticCentral AmericanCentral American IndianCherokeeCheyenneChickasawChileanChineseChippewaChoctawColombianColvilleComancheCosta RicanCreeCreekCroatianCrowCubanCypriotCzechCzechoslovakianDanishDelawareDominicanDutchDutch West IndianEastern EuropeanEcuadorianEgyptianEnglishEstonianEthiopianEuropeanFijianFilipinoFinnishFrenchFrench American IndianFrench CanadianGermanGerman RussianGhanaianGreekGuamanian/ChamorroGuatemalanHaitianHmongHonduranHopiHoumaHungarianIcelanderIndian (Asian)IndonesianInupiatIranianIraqiIrishIroquoisIsraeliItalianJamaicanJapaneseJordanianKenyanKiowaKoreanLaotianLatvianLebaneseLiberianLithuanianLumbeeLuxembourgerMacedonianMalaysianMalteseMarshalleseMenomineeMexicanMexican American IndianMongolianMoroccanNative HawaiianNavajoNepaleseNew ZealanderNicaraguanNigerianNorthern EuropeanNorwegianOkinawanOsageOttawaPaiutePakistaniPalestinianPanamanianParaguayanPennsylvania GermanPeruvianPimaPolishPortuguesePotawatomiPuebloPuerto RicanPuget Sound SalishRomanianRussianSalvadoranSamoanScandinavianScotch-IrishScottishSeminoleSenegaleseSerbianShoshoneSierra LeoneanSiouxSlavicSlovakSloveneSomaliSouth AfricanSouth AmericanSouth American IndianSoviet UnionSpaniardSpanishSpanish AmericanSpanish American IndianSri LankanSubsaharan AfricanSudaneseSwedishSwissSyrianTaiwaneseThaiTlingit-HaidaTohono O'OdhamTonganTrinidadian and TobagonianTsimshianTurkishU.S. Virgin IslanderUgandanUkrainianUruguayanUteVenezuelanVietnameseWelshWest IndianYakamaYaquiYugoslavianYumanYup'ikZimbabwean
Immigration
NonimmigrantsImmigrantsAfghanistanAfricaAlbaniaArgentinaArmeniaAsiaAustraliaAustriaBahamasBangladeshBarbadosBelarusBelgiumBelizeBoliviaBosnia and HerzegovinaBrazilBulgariaBurma/MyanmarCabo VerdeCambodiaCameroonCanadaCaribbeanCentral AmericaChileChinaColombiaCongoCosta RicaCroatiaCubaCzechoslovakiaDenmarkDominicaDominican RepublicEastern AfricaEastern AsiaEastern EuropeEcuadorEgyptEl SalvadorEnglandEritreaEthiopiaEuropeFijiFranceGermanyGhanaGreeceGrenadaGuatemalaGuyanaHaitiHondurasHong KongHungaryIndiaIndonesiaIranIraqIrelandIsraelItalyJamaicaJapanJordanKazakhstanKenyaKoreaKuwaitLaosLatin AmericaLatviaLebanonLiberiaLithuaniaMalaysiaMexicoMicronesiaMiddle AfricaMoldovaMoroccoNepalNetherlandsNicaraguaNigeriaNorth AmericaNorth MacedoniaNorthern AfricaNorthern EuropeNorwayOceaniaPakistanPanamaPeruPhilippinesPolandPortugalRomaniaRussiaSaudi ArabiaScotlandSenegalSerbiaSierra LeoneSingaporeSomaliaSouth AfricaSouth AmericaSouth Central AsiaSouth Eastern AsiaSouthern EuropeSpainSri LankaSt. Vincent and the GrenadinesSudanSwedenSwitzerlandSyriaTaiwanThailandTrinidad and TobagoTurkeyUgandaUkraineUruguayUzbekistanVenezuelaVietnamWest IndiesWestern AfricaWestern AsiaWestern EuropeYemenZaireZimbabweAzores
Guyanese
Race
Ancestry
AfghanAfricanAlaska NativeAlaskan AthabascanAlbanianAleutAlsatianAmericanApacheArabArapahoArgentineanArmenianAssyrian/Chaldean/SyriacAustralianAustrianBahamianBangladeshiBarbadianBasqueBelgianBelizeanBermudanBhutaneseBlackfeetBolivianBrazilianBritishBritish West IndianBulgarianBurmeseCajunCambodianCanadianCape VerdeanCarpatho RusynCelticCentral AmericanCentral American IndianCherokeeCheyenneChickasawChileanChineseChippewaChoctawColombianColvilleComancheCosta RicanCreeCreekCroatianCrowCubanCypriotCzechCzechoslovakianDanishDelawareDominicanDutchDutch West IndianEastern EuropeanEcuadorianEgyptianEnglishEstonianEthiopianEuropeanFijianFilipinoFinnishFrenchFrench American IndianFrench CanadianGermanGerman RussianGhanaianGreekGuamanian/ChamorroGuatemalanGuyaneseHaitianHmongHonduranHopiHoumaHungarianIcelanderIndian (Asian)IndonesianInupiatIranianIraqiIrishIroquoisIsraeliItalianJamaicanJapaneseJordanianKenyanKiowaKoreanLaotianLatvianLebaneseLiberianLithuanianLumbeeLuxembourgerMacedonianMalaysianMalteseMarshalleseMenomineeMexicanMexican American IndianMongolianMoroccanNative HawaiianNavajoNepaleseNew ZealanderNicaraguanNigerianNorthern EuropeanNorwegianOkinawanOsageOttawaPaiutePakistaniPalestinianPanamanianParaguayanPennsylvania GermanPeruvianPimaPolishPortuguesePotawatomiPuebloPuerto RicanPuget Sound SalishRomanianRussianSalvadoranSamoanScandinavianScotch-IrishScottishSeminoleSenegaleseSerbianShoshoneSierra LeoneanSiouxSlavicSlovakSloveneSomaliSouth AfricanSouth AmericanSouth American IndianSoviet UnionSpaniardSpanishSpanish AmericanSpanish American IndianSri LankanSubsaharan AfricanSudaneseSwedishSwissSyrianTaiwaneseThaiTlingit-HaidaTohono O'OdhamTonganTrinidadian and TobagonianTsimshianTurkishU.S. Virgin IslanderUgandanUkrainianUruguayanUteVenezuelanVietnameseWelshWest IndianYakamaYaquiYugoslavianYumanYup'ikZimbabwean
Immigration
NonimmigrantsImmigrantsAfghanistanAfricaAlbaniaArgentinaArmeniaAsiaAustraliaAustriaBahamasBangladeshBarbadosBelarusBelgiumBelizeBoliviaBosnia and HerzegovinaBrazilBurma/MyanmarCabo VerdeCambodiaCameroonCanadaCaribbeanCentral AmericaChileChinaColombiaCongoCosta RicaCroatiaCubaCzechoslovakiaDenmarkDominicaDominican RepublicEastern AfricaEastern AsiaEastern EuropeEcuadorEgyptEl SalvadorEnglandEritreaEthiopiaEuropeFijiFranceGermanyGhanaGreeceGrenadaGuatemalaGuyanaHaitiHondurasHong KongHungaryIndiaIndonesiaIranIraqIrelandIsraelItalyJamaicaJapanJordanKazakhstanKenyaKoreaKuwaitLaosLatin AmericaLatviaLebanonLiberiaLithuaniaMalaysiaMexicoMicronesiaMiddle AfricaMoldovaMoroccoNepalNetherlandsNicaraguaNigeriaNorth AmericaNorth MacedoniaNorthern AfricaNorthern EuropeNorwayOceaniaPakistanPanamaPeruPhilippinesPolandPortugalRomaniaRussiaSaudi ArabiaScotlandSenegalSerbiaSierra LeoneSingaporeSomaliaSouth AfricaSouth AmericaSouth Central AsiaSouth Eastern AsiaSouthern EuropeSpainSri LankaSt. Vincent and the GrenadinesSudanSwedenSwitzerlandSyriaTaiwanThailandTrinidad and TobagoTurkeyUgandaUkraineUruguayUzbekistanVenezuelaVietnamWest IndiesWestern AfricaWestern AsiaWestern EuropeYemenZaireZimbabweAzores
2nd Grade
Income
Poverty
Unemployment
Labor Participation
Family Structure
Vehicle Availability
Education Level
Disability

2nd Grade Comparison

Immigrants from Bulgaria

Guyanese

Excellent
Tragic
98.0%
2ND GRADE
89.7/ 100
METRIC RATING
135th/ 347
METRIC RANK
96.8%
2ND GRADE
0.0/ 100
METRIC RATING
311th/ 347
METRIC RANK

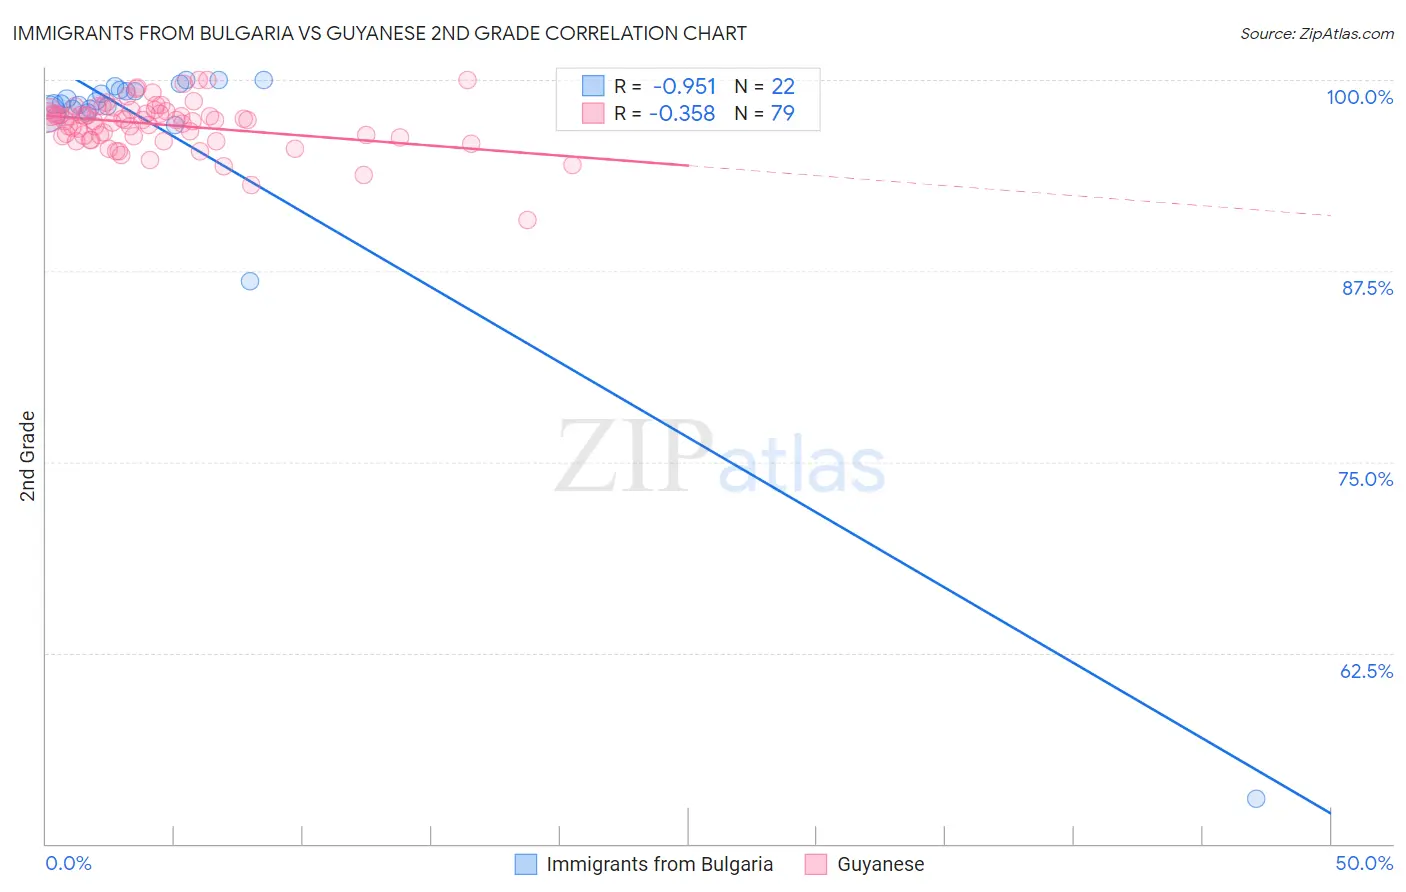
Immigrants from Bulgaria vs Guyanese 2nd Grade Correlation Chart

The statistical analysis conducted on geographies consisting of 172,552,181 people shows a perfect negative correlation between the proportion of Immigrants from Bulgaria and percentage of population with at least 2nd grade education in the United States with a correlation coefficient (R) of -0.951 and weighted average of 98.0%. Similarly, the statistical analysis conducted on geographies consisting of 176,921,765 people shows a mild negative correlation between the proportion of Guyanese and percentage of population with at least 2nd grade education in the United States with a correlation coefficient (R) of -0.358 and weighted average of 96.8%, a difference of 1.3%.
Immigrants from Bulgaria vs Guyanese 2nd Grade

2nd Grade Correlation Summary

MeasurementImmigrants from BulgariaGuyanese
Minimum52.9%90.9%
Maximum100.0%100.0%
Range47.1%9.1%
Mean96.2%97.1%
Median98.5%97.4%
Interquartile 25% (IQ1)98.1%96.4%
Interquartile 75% (IQ3)99.4%98.0%
Interquartile Range (IQR)1.2%1.6%
Standard Deviation (Sample)10.0%1.6%
Standard Deviation (Population)9.8%1.5%

Similar Demographics by 2nd Grade

Demographics Similar to Immigrants from Bulgaria by 2nd Grade

In terms of 2nd grade, the demographic groups most similar to Immigrants from Bulgaria are Immigrants from Hungary (98.0%, a difference of 0.0%), Immigrants from Kuwait (98.0%, a difference of 0.0%), Seminole (98.0%, a difference of 0.010%), Immigrants from Europe (98.0%, a difference of 0.010%), and Spaniard (98.0%, a difference of 0.010%).
DemographicsRating | Rank2nd Grade
Immigrants | Serbia
92.3
/100
|
#128
Exceptional
98.1%
Immigrants | Croatia
92.1
/100
|
#129
Exceptional
98.1%
Seminole
91.1
/100
|
#130
Exceptional
98.0%
Immigrants | Europe
91.1
/100
|
#131
Exceptional
98.0%
Spaniards
90.7
/100
|
#132
Exceptional
98.0%
Cambodians
90.7
/100
|
#133
Exceptional
98.0%
Immigrants | Hungary
89.7
/100
|
#134
Excellent
98.0%
Immigrants | Bulgaria
89.7
/100
|
#135
Excellent
98.0%
Immigrants | Kuwait
89.2
/100
|
#136
Excellent
98.0%
Immigrants | Romania
88.3
/100
|
#137
Excellent
98.0%
Israelis
87.9
/100
|
#138
Excellent
98.0%
Blackfeet
87.5
/100
|
#139
Excellent
98.0%
Palestinians
83.9
/100
|
#140
Excellent
98.0%
Immigrants | Turkey
83.0
/100
|
#141
Excellent
98.0%
Burmese
81.0
/100
|
#142
Excellent
98.0%

Demographics Similar to Guyanese by 2nd Grade

In terms of 2nd grade, the demographic groups most similar to Guyanese are Belizean (96.8%, a difference of 0.010%), Sri Lankan (96.8%, a difference of 0.010%), Cape Verdean (96.8%, a difference of 0.010%), Immigrants from the Azores (96.8%, a difference of 0.020%), and Immigrants from Haiti (96.8%, a difference of 0.020%).
DemographicsRating | Rank2nd Grade
Immigrants | Caribbean
0.0
/100
|
#304
Tragic
96.9%
Nicaraguans
0.0
/100
|
#305
Tragic
96.9%
Immigrants | Somalia
0.0
/100
|
#306
Tragic
96.9%
Immigrants | Azores
0.0
/100
|
#307
Tragic
96.8%
Immigrants | Haiti
0.0
/100
|
#308
Tragic
96.8%
Belizeans
0.0
/100
|
#309
Tragic
96.8%
Sri Lankans
0.0
/100
|
#310
Tragic
96.8%
Guyanese
0.0
/100
|
#311
Tragic
96.8%
Cape Verdeans
0.0
/100
|
#312
Tragic
96.8%
Hispanics or Latinos
0.0
/100
|
#313
Tragic
96.8%
Immigrants | Ecuador
0.0
/100
|
#314
Tragic
96.8%
Immigrants | Belize
0.0
/100
|
#315
Tragic
96.8%
Hondurans
0.0
/100
|
#316
Tragic
96.7%
Immigrants | Laos
0.0
/100
|
#317
Tragic
96.7%
Indonesians
0.0
/100
|
#318
Tragic
96.7%