Immigrants from Brazil vs Salvadoran College, Under 1 year
COMPARE
Immigrants from Brazil
Salvadoran
College, Under 1 year
College, Under 1 year Comparison
Immigrants from Brazil
Salvadorans
66.9%
COLLEGE, UNDER 1 YEAR
88.3/ 100
METRIC RATING
133rd/ 347
METRIC RANK
57.3%
COLLEGE, UNDER 1 YEAR
0.0/ 100
METRIC RATING
312th/ 347
METRIC RANK
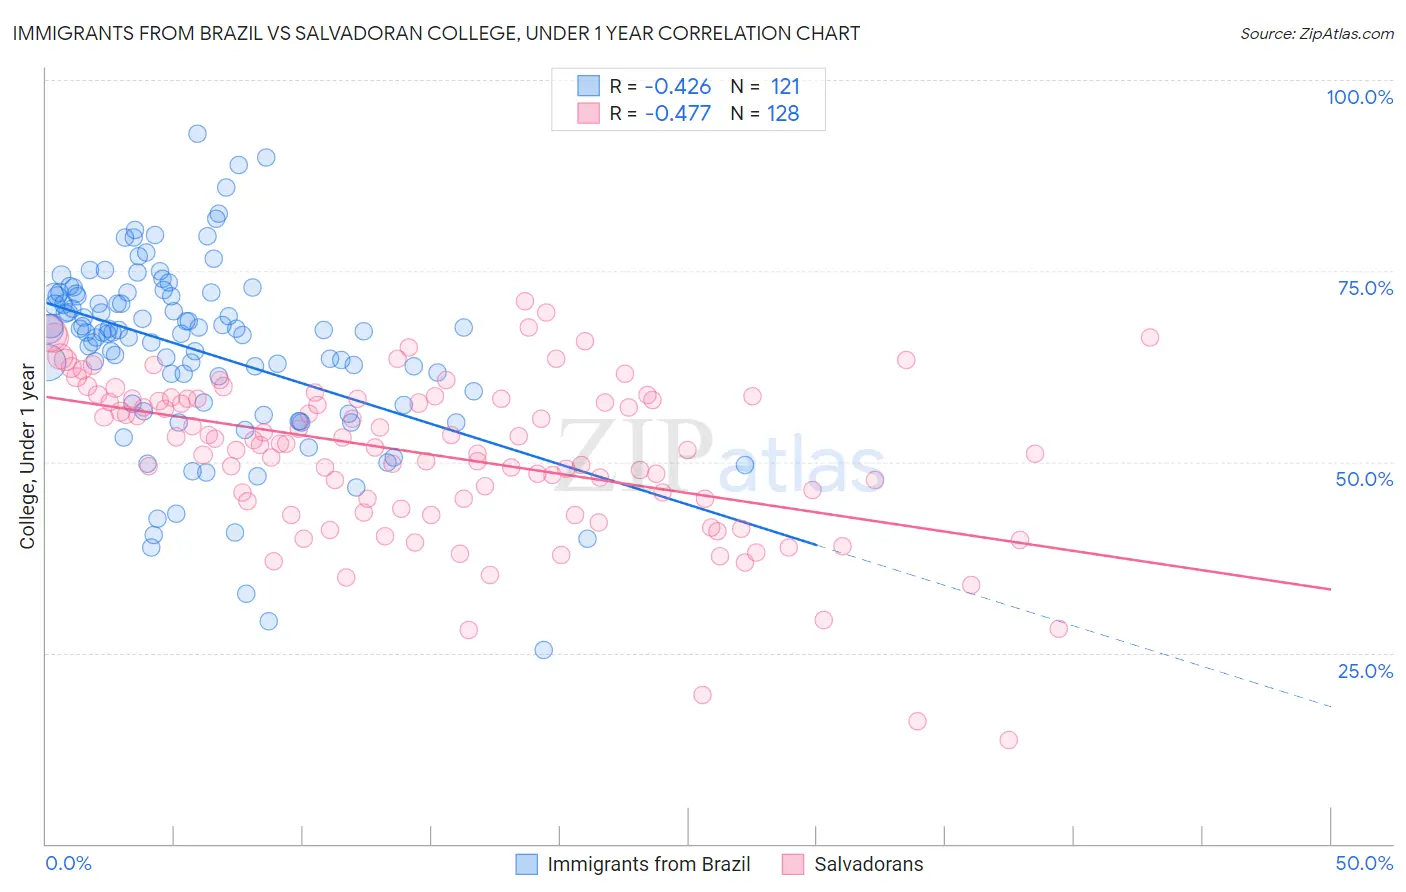
Immigrants from Brazil vs Salvadoran College, Under 1 year Correlation Chart
The statistical analysis conducted on geographies consisting of 343,021,697 people shows a moderate negative correlation between the proportion of Immigrants from Brazil and percentage of population with at least college, under 1 year education in the United States with a correlation coefficient (R) of -0.426 and weighted average of 66.9%. Similarly, the statistical analysis conducted on geographies consisting of 399,067,636 people shows a moderate negative correlation between the proportion of Salvadorans and percentage of population with at least college, under 1 year education in the United States with a correlation coefficient (R) of -0.477 and weighted average of 57.3%, a difference of 16.7%.
College, Under 1 year Correlation Summary
| Measurement | Immigrants from Brazil | Salvadoran |
| Minimum | 25.4% | 13.5% |
| Maximum | 93.0% | 71.0% |
| Range | 67.7% | 57.5% |
| Mean | 64.6% | 50.9% |
| Median | 67.0% | 52.3% |
| Interquartile 25% (IQ1) | 57.5% | 45.0% |
| Interquartile 75% (IQ3) | 71.9% | 58.3% |
| Interquartile Range (IQR) | 14.4% | 13.3% |
| Standard Deviation (Sample) | 12.0% | 10.6% |
| Standard Deviation (Population) | 11.9% | 10.6% |
Similar Demographics by College, Under 1 year
Demographics Similar to Immigrants from Brazil by College, Under 1 year
In terms of college, under 1 year, the demographic groups most similar to Immigrants from Brazil are Polish (66.9%, a difference of 0.010%), Finnish (66.9%, a difference of 0.030%), Iraqi (66.8%, a difference of 0.030%), Canadian (66.8%, a difference of 0.040%), and Ugandan (66.8%, a difference of 0.050%).
| Demographics | Rating | Rank | College, Under 1 year |
| Alsatians | 91.3 /100 | #126 | Exceptional 67.1% |
| Czechs | 90.8 /100 | #127 | Exceptional 67.1% |
| Scottish | 90.2 /100 | #128 | Exceptional 67.0% |
| Immigrants | Eastern Africa | 89.5 /100 | #129 | Excellent 67.0% |
| Immigrants | Syria | 89.0 /100 | #130 | Excellent 66.9% |
| Finns | 88.6 /100 | #131 | Excellent 66.9% |
| Poles | 88.4 /100 | #132 | Excellent 66.9% |
| Immigrants | Brazil | 88.3 /100 | #133 | Excellent 66.9% |
| Iraqis | 88.0 /100 | #134 | Excellent 66.8% |
| Canadians | 87.9 /100 | #135 | Excellent 66.8% |
| Ugandans | 87.8 /100 | #136 | Excellent 66.8% |
| Immigrants | Chile | 87.4 /100 | #137 | Excellent 66.8% |
| Immigrants | Italy | 86.9 /100 | #138 | Excellent 66.8% |
| Venezuelans | 85.9 /100 | #139 | Excellent 66.7% |
| Slavs | 85.9 /100 | #140 | Excellent 66.7% |
Demographics Similar to Salvadorans by College, Under 1 year
In terms of college, under 1 year, the demographic groups most similar to Salvadorans are Cajun (57.3%, a difference of 0.070%), Pueblo (57.4%, a difference of 0.12%), Dutch West Indian (57.2%, a difference of 0.24%), Hopi (57.1%, a difference of 0.36%), and Honduran (57.1%, a difference of 0.40%).
| Demographics | Rating | Rank | College, Under 1 year |
| Haitians | 0.0 /100 | #305 | Tragic 57.8% |
| Immigrants | Portugal | 0.0 /100 | #306 | Tragic 57.7% |
| Fijians | 0.0 /100 | #307 | Tragic 57.7% |
| Central Americans | 0.0 /100 | #308 | Tragic 57.7% |
| Immigrants | Nicaragua | 0.0 /100 | #309 | Tragic 57.6% |
| Pueblo | 0.0 /100 | #310 | Tragic 57.4% |
| Cajuns | 0.0 /100 | #311 | Tragic 57.3% |
| Salvadorans | 0.0 /100 | #312 | Tragic 57.3% |
| Dutch West Indians | 0.0 /100 | #313 | Tragic 57.2% |
| Hopi | 0.0 /100 | #314 | Tragic 57.1% |
| Hondurans | 0.0 /100 | #315 | Tragic 57.1% |
| Menominee | 0.0 /100 | #316 | Tragic 57.0% |
| Hispanics or Latinos | 0.0 /100 | #317 | Tragic 57.0% |
| Immigrants | Haiti | 0.0 /100 | #318 | Tragic 56.9% |
| Puerto Ricans | 0.0 /100 | #319 | Tragic 56.8% |