Immigrants from Brazil vs Portuguese 6th Grade
COMPARE
Immigrants from Brazil
Portuguese
6th Grade
6th Grade Comparison
Immigrants from Brazil
Portuguese
96.9%
6TH GRADE
25.5/ 100
METRIC RATING
195th/ 347
METRIC RANK
96.8%
6TH GRADE
8.2/ 100
METRIC RATING
214th/ 347
METRIC RANK
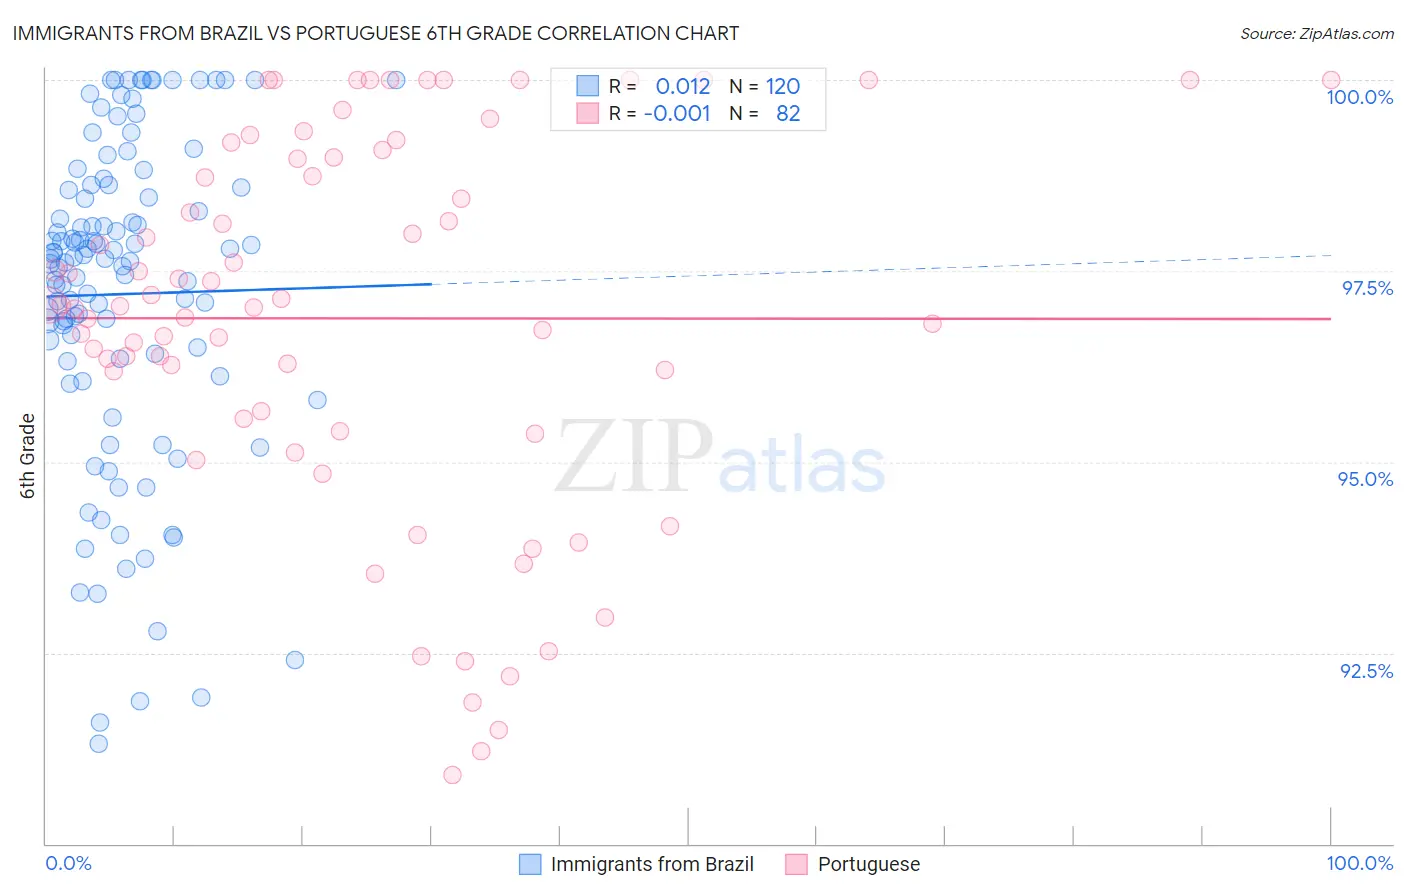
Immigrants from Brazil vs Portuguese 6th Grade Correlation Chart
The statistical analysis conducted on geographies consisting of 343,021,580 people shows no correlation between the proportion of Immigrants from Brazil and percentage of population with at least 6th grade education in the United States with a correlation coefficient (R) of 0.012 and weighted average of 96.9%. Similarly, the statistical analysis conducted on geographies consisting of 450,351,764 people shows no correlation between the proportion of Portuguese and percentage of population with at least 6th grade education in the United States with a correlation coefficient (R) of -0.001 and weighted average of 96.8%, a difference of 0.15%.
6th Grade Correlation Summary
| Measurement | Immigrants from Brazil | Portuguese |
| Minimum | 91.3% | 90.9% |
| Maximum | 100.0% | 100.0% |
| Range | 8.7% | 9.1% |
| Mean | 97.2% | 96.9% |
| Median | 97.6% | 97.0% |
| Interquartile 25% (IQ1) | 96.3% | 95.6% |
| Interquartile 75% (IQ3) | 98.6% | 99.0% |
| Interquartile Range (IQR) | 2.2% | 3.4% |
| Standard Deviation (Sample) | 2.1% | 2.5% |
| Standard Deviation (Population) | 2.1% | 2.4% |
Demographics Similar to Immigrants from Brazil and Portuguese by 6th Grade
In terms of 6th grade, the demographic groups most similar to Immigrants from Brazil are Immigrants from Lebanon (96.9%, a difference of 0.0%), Immigrants from Uganda (96.9%, a difference of 0.030%), Brazilian (96.9%, a difference of 0.040%), Immigrants from Albania (96.9%, a difference of 0.040%), and Immigrants from Northern Africa (96.9%, a difference of 0.070%). Similarly, the demographic groups most similar to Portuguese are Immigrants from Iraq (96.8%, a difference of 0.010%), Moroccan (96.8%, a difference of 0.010%), Immigrants from Sudan (96.8%, a difference of 0.010%), Immigrants from Nepal (96.8%, a difference of 0.030%), and Iraqi (96.8%, a difference of 0.040%).
| Demographics | Rating | Rank | 6th Grade |
| Immigrants | Lebanon | 25.6 /100 | #194 | Fair 96.9% |
| Immigrants | Brazil | 25.5 /100 | #195 | Fair 96.9% |
| Immigrants | Uganda | 21.2 /100 | #196 | Fair 96.9% |
| Brazilians | 20.1 /100 | #197 | Fair 96.9% |
| Immigrants | Albania | 18.8 /100 | #198 | Poor 96.9% |
| Immigrants | Northern Africa | 15.7 /100 | #199 | Poor 96.9% |
| Africans | 14.8 /100 | #200 | Poor 96.9% |
| Immigrants | Zaire | 14.5 /100 | #201 | Poor 96.9% |
| Immigrants | Chile | 14.2 /100 | #202 | Poor 96.8% |
| Sudanese | 13.9 /100 | #203 | Poor 96.8% |
| Immigrants | Bahamas | 13.8 /100 | #204 | Poor 96.8% |
| Natives/Alaskans | 13.0 /100 | #205 | Poor 96.8% |
| Laotians | 11.8 /100 | #206 | Poor 96.8% |
| Iraqis | 11.7 /100 | #207 | Poor 96.8% |
| Samoans | 11.0 /100 | #208 | Poor 96.8% |
| Immigrants | Oceania | 11.0 /100 | #209 | Poor 96.8% |
| Immigrants | Nepal | 10.1 /100 | #210 | Poor 96.8% |
| Immigrants | Iraq | 9.2 /100 | #211 | Tragic 96.8% |
| Moroccans | 9.0 /100 | #212 | Tragic 96.8% |
| Immigrants | Sudan | 8.7 /100 | #213 | Tragic 96.8% |
| Portuguese | 8.2 /100 | #214 | Tragic 96.8% |