Immigrants from Brazil vs Immigrants from Saudi Arabia Associate's Degree
COMPARE
Immigrants from Brazil
Immigrants from Saudi Arabia
Associate's Degree
Associate's Degree Comparison
Immigrants from Brazil
Immigrants from Saudi Arabia
50.0%
ASSOCIATE'S DEGREE
98.5/ 100
METRIC RATING
93rd/ 347
METRIC RANK
52.6%
ASSOCIATE'S DEGREE
99.9/ 100
METRIC RATING
41st/ 347
METRIC RANK
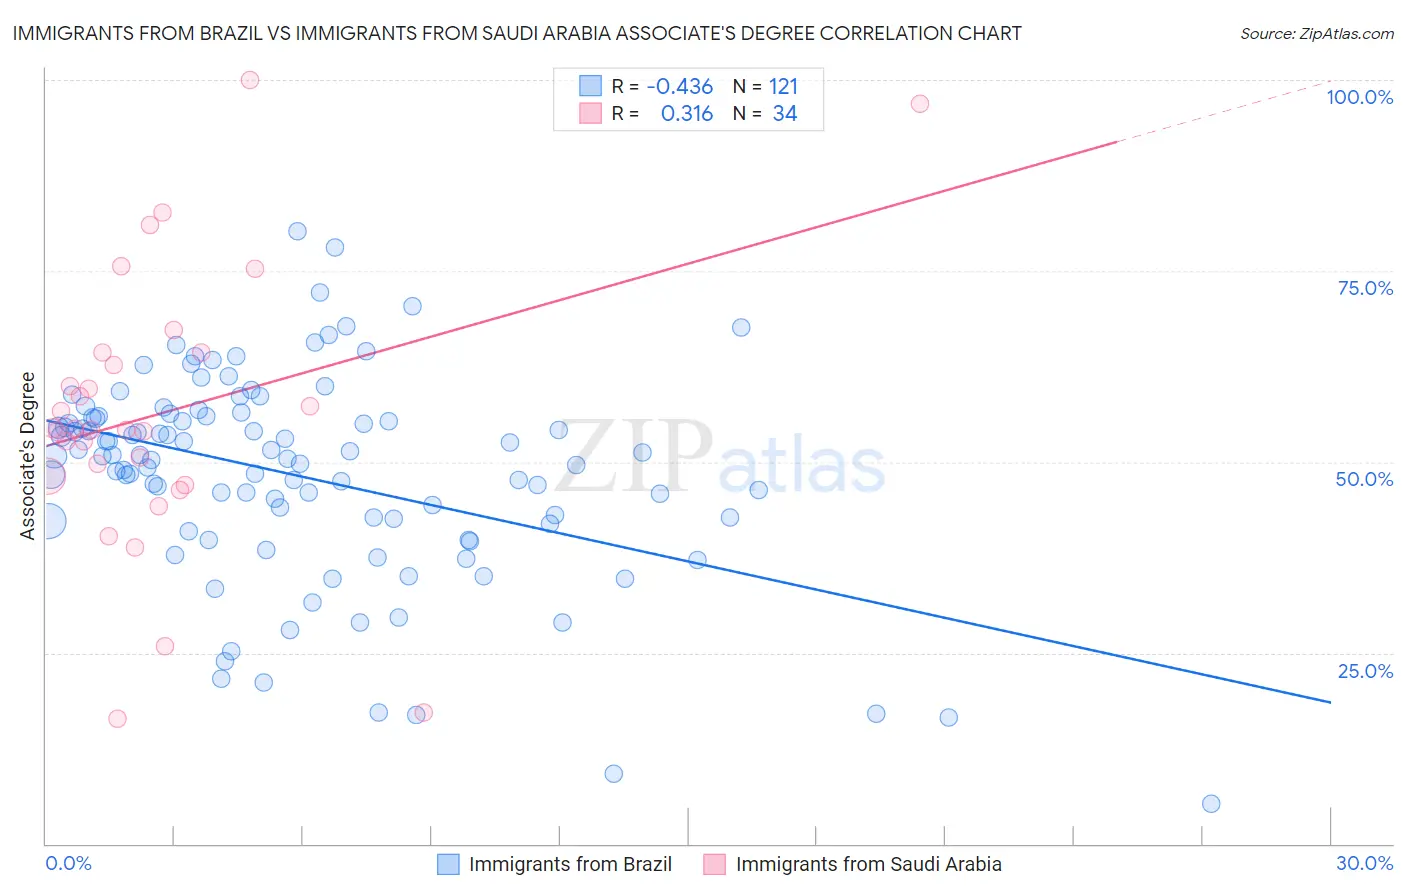
Immigrants from Brazil vs Immigrants from Saudi Arabia Associate's Degree Correlation Chart
The statistical analysis conducted on geographies consisting of 343,003,765 people shows a moderate negative correlation between the proportion of Immigrants from Brazil and percentage of population with at least associate's degree education in the United States with a correlation coefficient (R) of -0.436 and weighted average of 50.0%. Similarly, the statistical analysis conducted on geographies consisting of 164,289,450 people shows a mild positive correlation between the proportion of Immigrants from Saudi Arabia and percentage of population with at least associate's degree education in the United States with a correlation coefficient (R) of 0.316 and weighted average of 52.6%, a difference of 5.1%.
Associate's Degree Correlation Summary
| Measurement | Immigrants from Brazil | Immigrants from Saudi Arabia |
| Minimum | 5.3% | 16.3% |
| Maximum | 80.2% | 100.0% |
| Range | 75.0% | 83.7% |
| Mean | 48.1% | 56.4% |
| Median | 50.7% | 54.3% |
| Interquartile 25% (IQ1) | 42.1% | 48.1% |
| Interquartile 75% (IQ3) | 55.9% | 64.3% |
| Interquartile Range (IQR) | 13.7% | 16.2% |
| Standard Deviation (Sample) | 13.6% | 18.3% |
| Standard Deviation (Population) | 13.5% | 18.1% |
Similar Demographics by Associate's Degree
Demographics Similar to Immigrants from Brazil by Associate's Degree
In terms of associate's degree, the demographic groups most similar to Immigrants from Brazil are Laotian (49.9%, a difference of 0.13%), Immigrants from North America (50.1%, a difference of 0.15%), Immigrants from Western Asia (50.1%, a difference of 0.18%), Immigrants from Ethiopia (50.1%, a difference of 0.25%), and Immigrants from Western Europe (50.1%, a difference of 0.26%).
| Demographics | Rating | Rank | Associate's Degree |
| Immigrants | Croatia | 98.9 /100 | #86 | Exceptional 50.2% |
| Immigrants | Moldova | 98.8 /100 | #87 | Exceptional 50.2% |
| Immigrants | Canada | 98.7 /100 | #88 | Exceptional 50.1% |
| Immigrants | Western Europe | 98.7 /100 | #89 | Exceptional 50.1% |
| Immigrants | Ethiopia | 98.7 /100 | #90 | Exceptional 50.1% |
| Immigrants | Western Asia | 98.7 /100 | #91 | Exceptional 50.1% |
| Immigrants | North America | 98.7 /100 | #92 | Exceptional 50.1% |
| Immigrants | Brazil | 98.5 /100 | #93 | Exceptional 50.0% |
| Laotians | 98.4 /100 | #94 | Exceptional 49.9% |
| Immigrants | England | 98.0 /100 | #95 | Exceptional 49.7% |
| Romanians | 98.0 /100 | #96 | Exceptional 49.7% |
| Immigrants | Ukraine | 98.0 /100 | #97 | Exceptional 49.7% |
| Immigrants | Northern Africa | 97.9 /100 | #98 | Exceptional 49.7% |
| Macedonians | 97.8 /100 | #99 | Exceptional 49.6% |
| Immigrants | Nepal | 97.5 /100 | #100 | Exceptional 49.5% |
Demographics Similar to Immigrants from Saudi Arabia by Associate's Degree
In terms of associate's degree, the demographic groups most similar to Immigrants from Saudi Arabia are Immigrants from Malaysia (52.5%, a difference of 0.030%), Immigrants from South Africa (52.5%, a difference of 0.040%), Estonian (52.5%, a difference of 0.13%), Immigrants from Lithuania (52.4%, a difference of 0.20%), and Immigrants from Bulgaria (52.4%, a difference of 0.34%).
| Demographics | Rating | Rank | Associate's Degree |
| Bulgarians | 100.0 /100 | #34 | Exceptional 53.3% |
| Russians | 100.0 /100 | #35 | Exceptional 53.2% |
| Immigrants | Russia | 100.0 /100 | #36 | Exceptional 53.1% |
| Immigrants | Denmark | 100.0 /100 | #37 | Exceptional 53.1% |
| Mongolians | 100.0 /100 | #38 | Exceptional 53.0% |
| Immigrants | Belarus | 99.9 /100 | #39 | Exceptional 52.8% |
| Immigrants | Latvia | 99.9 /100 | #40 | Exceptional 52.8% |
| Immigrants | Saudi Arabia | 99.9 /100 | #41 | Exceptional 52.6% |
| Immigrants | Malaysia | 99.9 /100 | #42 | Exceptional 52.5% |
| Immigrants | South Africa | 99.9 /100 | #43 | Exceptional 52.5% |
| Estonians | 99.9 /100 | #44 | Exceptional 52.5% |
| Immigrants | Lithuania | 99.9 /100 | #45 | Exceptional 52.4% |
| Immigrants | Bulgaria | 99.9 /100 | #46 | Exceptional 52.4% |
| Immigrants | Kuwait | 99.9 /100 | #47 | Exceptional 52.4% |
| Immigrants | Norway | 99.9 /100 | #48 | Exceptional 52.2% |