Immigrants from Brazil vs Immigrants from Kenya 7th Grade
COMPARE
Immigrants from Brazil
Immigrants from Kenya
7th Grade
7th Grade Comparison
Immigrants from Brazil
Immigrants from Kenya
96.0%
7TH GRADE
46.8/ 100
METRIC RATING
180th/ 347
METRIC RANK
96.1%
7TH GRADE
66.8/ 100
METRIC RATING
160th/ 347
METRIC RANK
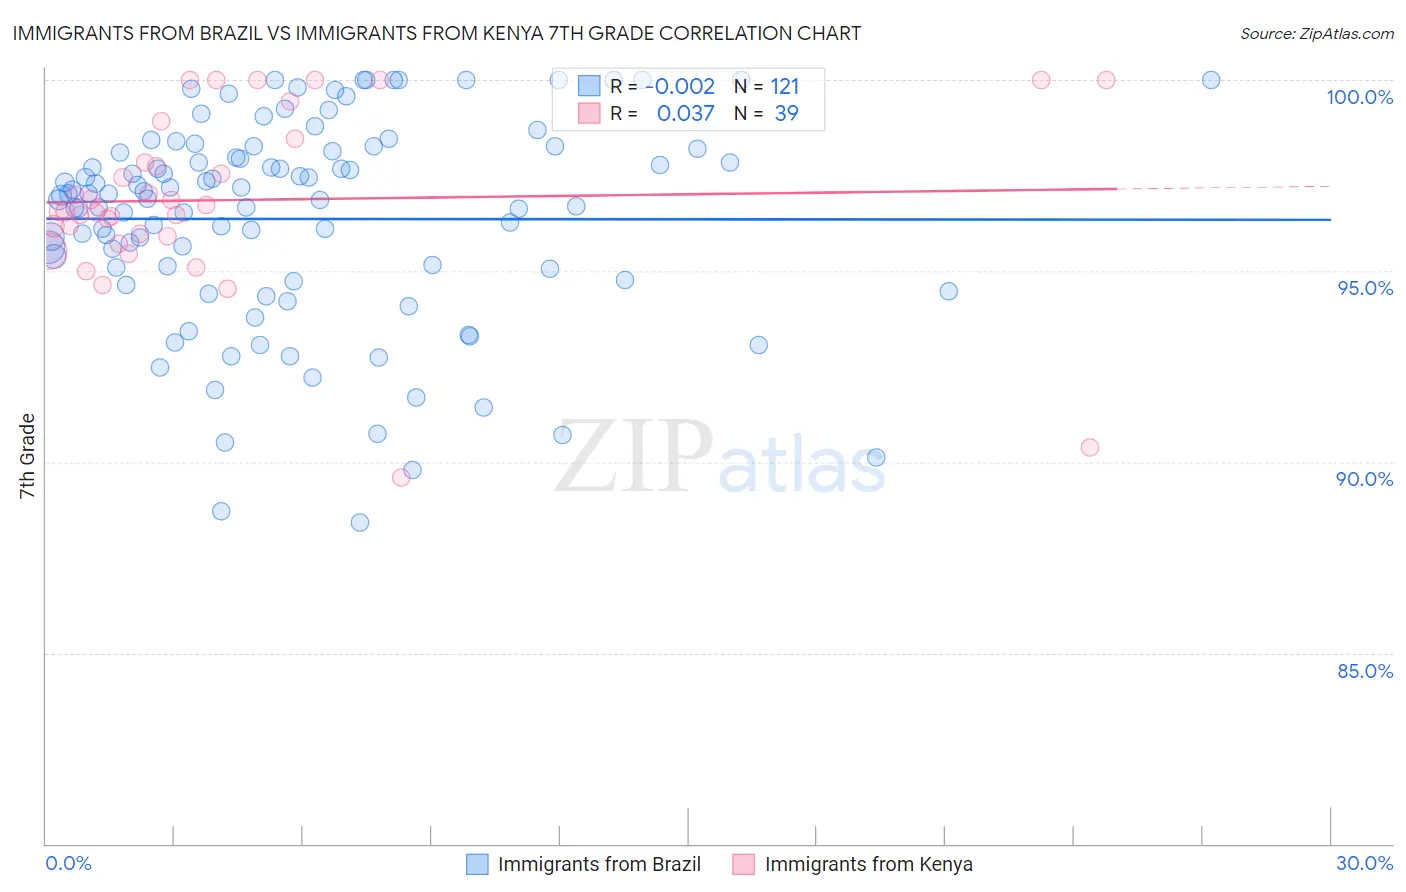
Immigrants from Brazil vs Immigrants from Kenya 7th Grade Correlation Chart
The statistical analysis conducted on geographies consisting of 343,021,697 people shows no correlation between the proportion of Immigrants from Brazil and percentage of population with at least 7th grade education in the United States with a correlation coefficient (R) of -0.002 and weighted average of 96.0%. Similarly, the statistical analysis conducted on geographies consisting of 218,076,690 people shows no correlation between the proportion of Immigrants from Kenya and percentage of population with at least 7th grade education in the United States with a correlation coefficient (R) of 0.037 and weighted average of 96.1%, a difference of 0.13%.
7th Grade Correlation Summary
| Measurement | Immigrants from Brazil | Immigrants from Kenya |
| Minimum | 88.4% | 89.6% |
| Maximum | 100.0% | 100.0% |
| Range | 11.6% | 10.4% |
| Mean | 96.4% | 96.9% |
| Median | 97.0% | 96.6% |
| Interquartile 25% (IQ1) | 94.9% | 95.9% |
| Interquartile 75% (IQ3) | 98.2% | 98.5% |
| Interquartile Range (IQR) | 3.3% | 2.6% |
| Standard Deviation (Sample) | 2.7% | 2.3% |
| Standard Deviation (Population) | 2.7% | 2.3% |
Demographics Similar to Immigrants from Brazil and Immigrants from Kenya by 7th Grade
In terms of 7th grade, the demographic groups most similar to Immigrants from Brazil are Immigrants from Korea (96.0%, a difference of 0.010%), Marshallese (96.0%, a difference of 0.010%), Immigrants from Iran (96.0%, a difference of 0.010%), Immigrants from Albania (96.0%, a difference of 0.020%), and Mongolian (96.0%, a difference of 0.020%). Similarly, the demographic groups most similar to Immigrants from Kenya are Bermudan (96.1%, a difference of 0.0%), Pima (96.1%, a difference of 0.020%), Spaniard (96.1%, a difference of 0.030%), Immigrants from Italy (96.1%, a difference of 0.030%), and Immigrants from Taiwan (96.1%, a difference of 0.040%).
| Demographics | Rating | Rank | 7th Grade |
| Immigrants | Kenya | 66.8 /100 | #160 | Good 96.1% |
| Bermudans | 66.3 /100 | #161 | Good 96.1% |
| Pima | 64.3 /100 | #162 | Good 96.1% |
| Spaniards | 62.6 /100 | #163 | Good 96.1% |
| Immigrants | Italy | 62.1 /100 | #164 | Good 96.1% |
| Immigrants | Taiwan | 61.5 /100 | #165 | Good 96.1% |
| Immigrants | Kazakhstan | 61.0 /100 | #166 | Good 96.1% |
| Immigrants | Sri Lanka | 59.9 /100 | #167 | Average 96.1% |
| Immigrants | Poland | 59.0 /100 | #168 | Average 96.1% |
| Ute | 55.8 /100 | #169 | Average 96.1% |
| Immigrants | Ukraine | 55.0 /100 | #170 | Average 96.1% |
| Egyptians | 54.2 /100 | #171 | Average 96.1% |
| Venezuelans | 51.4 /100 | #172 | Average 96.0% |
| Immigrants | Albania | 50.4 /100 | #173 | Average 96.0% |
| Mongolians | 50.0 /100 | #174 | Average 96.0% |
| Blacks/African Americans | 49.5 /100 | #175 | Average 96.0% |
| Chileans | 49.3 /100 | #176 | Average 96.0% |
| Immigrants | Korea | 49.2 /100 | #177 | Average 96.0% |
| Marshallese | 48.4 /100 | #178 | Average 96.0% |
| Immigrants | Iran | 47.8 /100 | #179 | Average 96.0% |
| Immigrants | Brazil | 46.8 /100 | #180 | Average 96.0% |