Immigrants from Bosnia and Herzegovina vs Pueblo 12th Grade, No Diploma
COMPARE
Immigrants from Bosnia and Herzegovina
Pueblo
12th Grade, No Diploma
12th Grade, No Diploma Comparison
Immigrants from Bosnia and Herzegovina
Pueblo
91.7%
12TH GRADE, NO DIPLOMA
87.3/ 100
METRIC RATING
135th/ 347
METRIC RANK
88.2%
12TH GRADE, NO DIPLOMA
0.0/ 100
METRIC RATING
297th/ 347
METRIC RANK
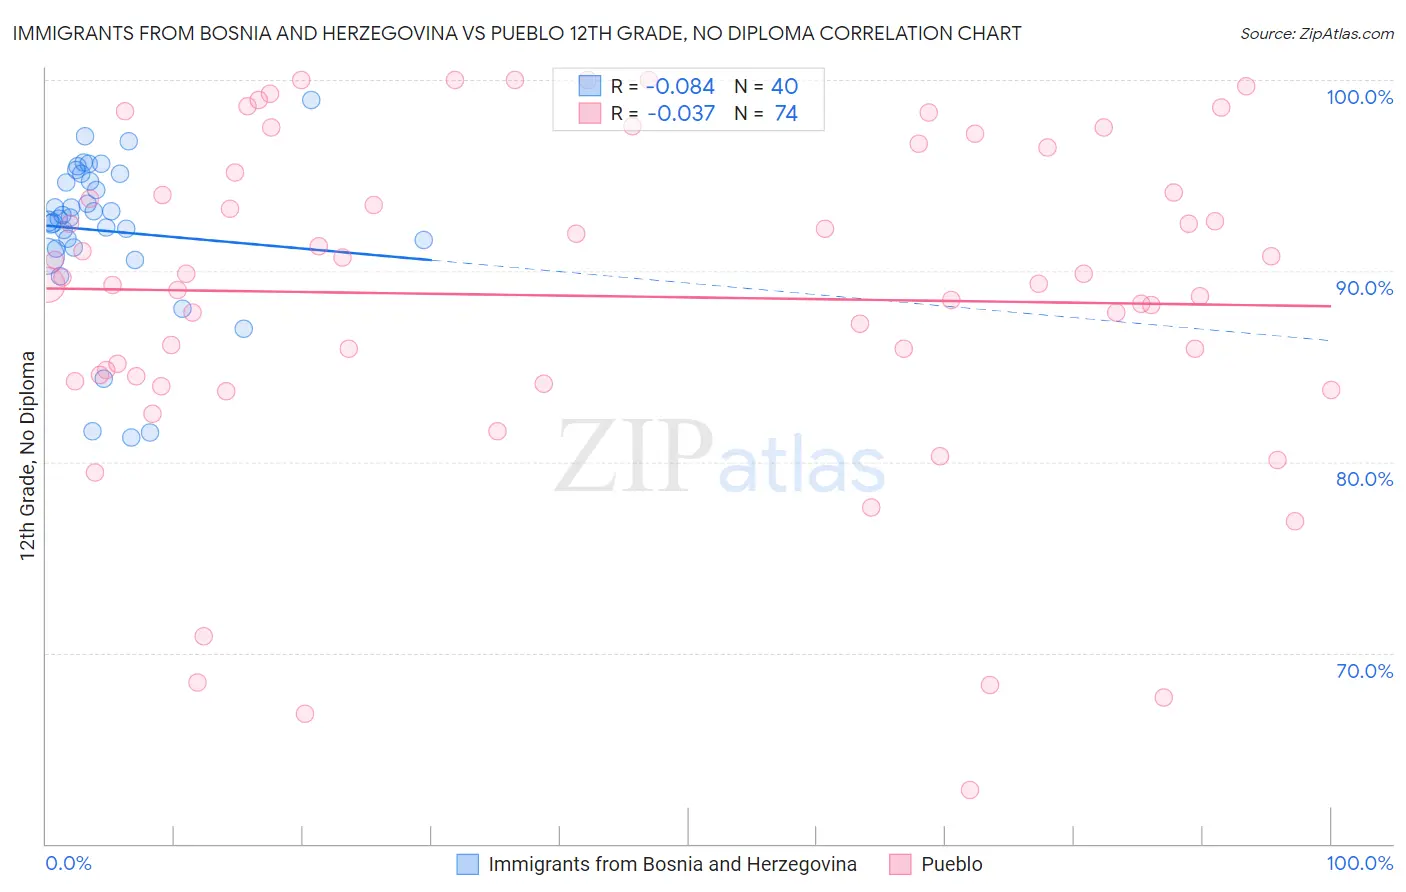
Immigrants from Bosnia and Herzegovina vs Pueblo 12th Grade, No Diploma Correlation Chart
The statistical analysis conducted on geographies consisting of 156,819,615 people shows a slight negative correlation between the proportion of Immigrants from Bosnia and Herzegovina and percentage of population with at least 12th grade (no diploma) education in the United States with a correlation coefficient (R) of -0.084 and weighted average of 91.7%. Similarly, the statistical analysis conducted on geographies consisting of 120,086,593 people shows no correlation between the proportion of Pueblo and percentage of population with at least 12th grade (no diploma) education in the United States with a correlation coefficient (R) of -0.037 and weighted average of 88.2%, a difference of 4.0%.
12th Grade, No Diploma Correlation Summary
| Measurement | Immigrants from Bosnia and Herzegovina | Pueblo |
| Minimum | 81.3% | 62.8% |
| Maximum | 98.9% | 100.0% |
| Range | 17.7% | 37.2% |
| Mean | 92.1% | 88.7% |
| Median | 92.8% | 89.5% |
| Interquartile 25% (IQ1) | 91.2% | 84.5% |
| Interquartile 75% (IQ3) | 94.9% | 95.1% |
| Interquartile Range (IQR) | 3.7% | 10.7% |
| Standard Deviation (Sample) | 4.1% | 8.7% |
| Standard Deviation (Population) | 4.0% | 8.7% |
Similar Demographics by 12th Grade, No Diploma
Demographics Similar to Immigrants from Bosnia and Herzegovina by 12th Grade, No Diploma
In terms of 12th grade, no diploma, the demographic groups most similar to Immigrants from Bosnia and Herzegovina are Immigrants from Italy (91.7%, a difference of 0.030%), Venezuelan (91.7%, a difference of 0.030%), Chilean (91.7%, a difference of 0.040%), Albanian (91.8%, a difference of 0.060%), and Immigrants from Eastern Asia (91.8%, a difference of 0.060%).
| Demographics | Rating | Rank | 12th Grade, No Diploma |
| Mongolians | 89.9 /100 | #128 | Excellent 91.8% |
| German Russians | 89.8 /100 | #129 | Excellent 91.8% |
| Assyrians/Chaldeans/Syriacs | 89.6 /100 | #130 | Excellent 91.8% |
| Albanians | 89.3 /100 | #131 | Excellent 91.8% |
| Immigrants | Eastern Asia | 89.3 /100 | #132 | Excellent 91.8% |
| Immigrants | Italy | 88.3 /100 | #133 | Excellent 91.7% |
| Venezuelans | 88.2 /100 | #134 | Excellent 91.7% |
| Immigrants | Bosnia and Herzegovina | 87.3 /100 | #135 | Excellent 91.7% |
| Chileans | 85.8 /100 | #136 | Excellent 91.7% |
| Alaska Natives | 84.9 /100 | #137 | Excellent 91.6% |
| Arabs | 84.1 /100 | #138 | Excellent 91.6% |
| Immigrants | Egypt | 83.9 /100 | #139 | Excellent 91.6% |
| Immigrants | Poland | 82.3 /100 | #140 | Excellent 91.6% |
| Argentineans | 82.0 /100 | #141 | Excellent 91.6% |
| Immigrants | Venezuela | 80.9 /100 | #142 | Excellent 91.6% |
Demographics Similar to Pueblo by 12th Grade, No Diploma
In terms of 12th grade, no diploma, the demographic groups most similar to Pueblo are Fijian (88.2%, a difference of 0.010%), Immigrants (88.2%, a difference of 0.030%), Immigrants from Haiti (88.2%, a difference of 0.050%), Guyanese (88.3%, a difference of 0.070%), and Nepalese (88.1%, a difference of 0.10%).
| Demographics | Rating | Rank | 12th Grade, No Diploma |
| British West Indians | 0.0 /100 | #290 | Tragic 88.5% |
| Haitians | 0.0 /100 | #291 | Tragic 88.5% |
| Immigrants | Grenada | 0.0 /100 | #292 | Tragic 88.4% |
| Japanese | 0.0 /100 | #293 | Tragic 88.3% |
| Guyanese | 0.0 /100 | #294 | Tragic 88.3% |
| Immigrants | Immigrants | 0.0 /100 | #295 | Tragic 88.2% |
| Fijians | 0.0 /100 | #296 | Tragic 88.2% |
| Pueblo | 0.0 /100 | #297 | Tragic 88.2% |
| Immigrants | Haiti | 0.0 /100 | #298 | Tragic 88.2% |
| Nepalese | 0.0 /100 | #299 | Tragic 88.1% |
| Immigrants | Guyana | 0.0 /100 | #300 | Tragic 88.1% |
| Immigrants | Cambodia | 0.0 /100 | #301 | Tragic 88.1% |
| Ecuadorians | 0.0 /100 | #302 | Tragic 88.0% |
| Immigrants | Bangladesh | 0.0 /100 | #303 | Tragic 88.0% |
| Vietnamese | 0.0 /100 | #304 | Tragic 87.9% |