Immigrants from Bosnia and Herzegovina vs Mexican Bachelor's Degree
COMPARE
Immigrants from Bosnia and Herzegovina
Mexican
Bachelor's Degree
Bachelor's Degree Comparison
Immigrants from Bosnia and Herzegovina
Mexicans
37.6%
BACHELOR'S DEGREE
43.4/ 100
METRIC RATING
182nd/ 347
METRIC RANK
27.1%
BACHELOR'S DEGREE
0.0/ 100
METRIC RATING
333rd/ 347
METRIC RANK
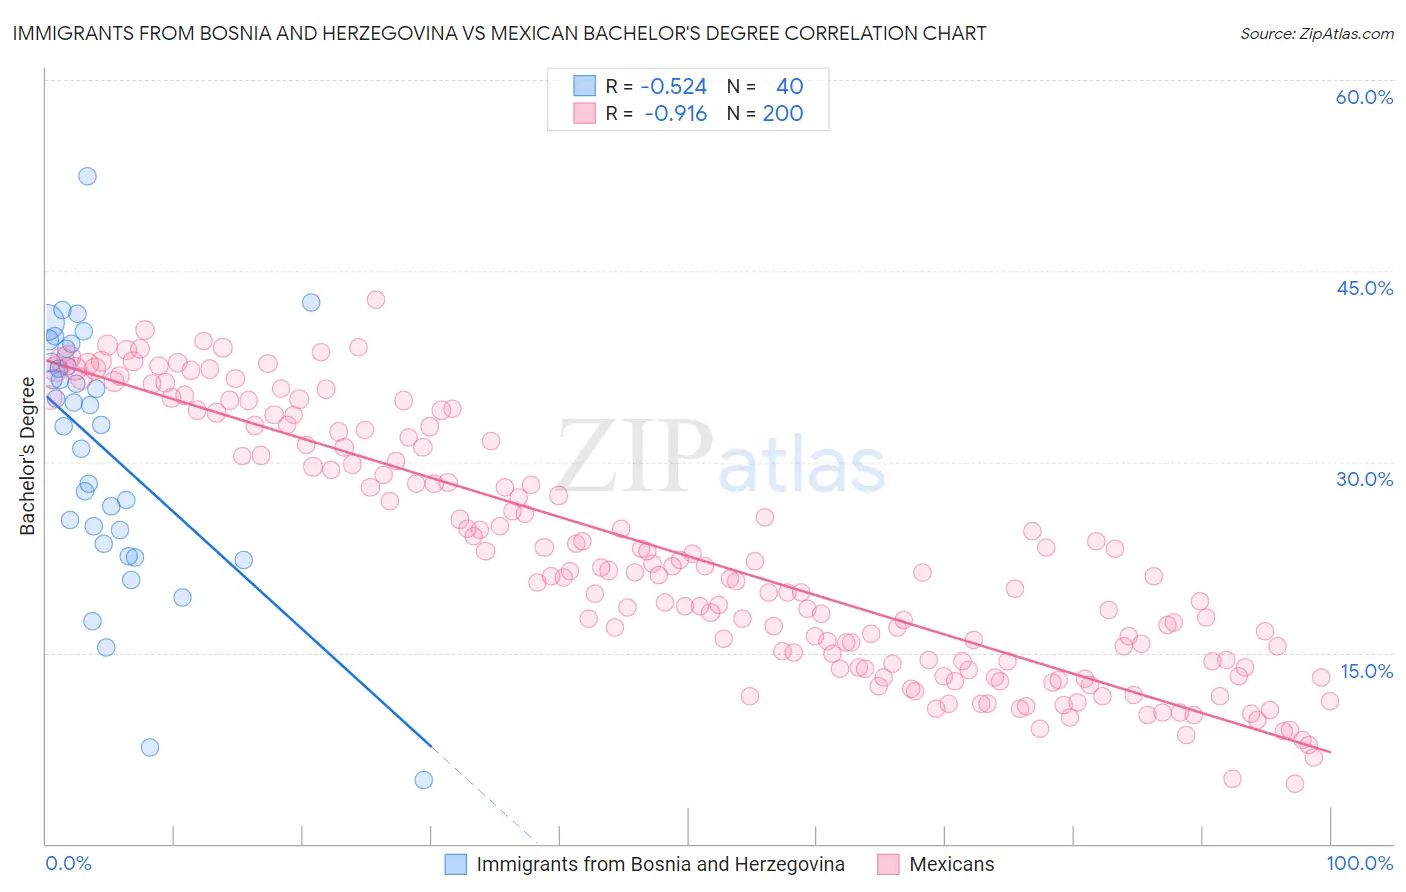
Immigrants from Bosnia and Herzegovina vs Mexican Bachelor's Degree Correlation Chart
The statistical analysis conducted on geographies consisting of 156,817,414 people shows a substantial negative correlation between the proportion of Immigrants from Bosnia and Herzegovina and percentage of population with at least bachelor's degree education in the United States with a correlation coefficient (R) of -0.524 and weighted average of 37.6%. Similarly, the statistical analysis conducted on geographies consisting of 565,096,566 people shows a near-perfect negative correlation between the proportion of Mexicans and percentage of population with at least bachelor's degree education in the United States with a correlation coefficient (R) of -0.916 and weighted average of 27.1%, a difference of 38.8%.
Bachelor's Degree Correlation Summary
| Measurement | Immigrants from Bosnia and Herzegovina | Mexican |
| Minimum | 5.0% | 4.7% |
| Maximum | 52.4% | 42.7% |
| Range | 47.4% | 38.0% |
| Mean | 30.9% | 22.6% |
| Median | 33.7% | 21.0% |
| Interquartile 25% (IQ1) | 24.1% | 14.2% |
| Interquartile 75% (IQ3) | 38.3% | 31.5% |
| Interquartile Range (IQR) | 14.2% | 17.2% |
| Standard Deviation (Sample) | 10.0% | 9.7% |
| Standard Deviation (Population) | 9.9% | 9.7% |
Similar Demographics by Bachelor's Degree
Demographics Similar to Immigrants from Bosnia and Herzegovina by Bachelor's Degree
In terms of bachelor's degree, the demographic groups most similar to Immigrants from Bosnia and Herzegovina are Immigrants from Senegal (37.6%, a difference of 0.030%), Irish (37.6%, a difference of 0.090%), Senegalese (37.5%, a difference of 0.13%), Scandinavian (37.5%, a difference of 0.17%), and Immigrants from Colombia (37.7%, a difference of 0.20%).
| Demographics | Rating | Rank | Bachelor's Degree |
| Immigrants | Uruguay | 48.3 /100 | #175 | Average 37.8% |
| Costa Ricans | 47.6 /100 | #176 | Average 37.7% |
| Basques | 47.4 /100 | #177 | Average 37.7% |
| Immigrants | Cameroon | 46.8 /100 | #178 | Average 37.7% |
| Immigrants | Colombia | 45.4 /100 | #179 | Average 37.7% |
| Irish | 44.3 /100 | #180 | Average 37.6% |
| Immigrants | Senegal | 43.8 /100 | #181 | Average 37.6% |
| Immigrants | Bosnia and Herzegovina | 43.4 /100 | #182 | Average 37.6% |
| Senegalese | 42.2 /100 | #183 | Average 37.5% |
| Scandinavians | 41.7 /100 | #184 | Average 37.5% |
| Immigrants | Peru | 41.3 /100 | #185 | Average 37.5% |
| Norwegians | 40.4 /100 | #186 | Average 37.5% |
| English | 39.7 /100 | #187 | Fair 37.4% |
| Immigrants | Oceania | 37.3 /100 | #188 | Fair 37.3% |
| Slovaks | 36.9 /100 | #189 | Fair 37.3% |
Demographics Similar to Mexicans by Bachelor's Degree
In terms of bachelor's degree, the demographic groups most similar to Mexicans are Menominee (27.3%, a difference of 0.82%), Immigrants from the Azores (27.3%, a difference of 0.92%), Spanish American Indian (27.5%, a difference of 1.4%), Immigrants from Central America (27.5%, a difference of 1.5%), and Arapaho (26.6%, a difference of 1.7%).
| Demographics | Rating | Rank | Bachelor's Degree |
| Apache | 0.0 /100 | #326 | Tragic 28.3% |
| Paiute | 0.0 /100 | #327 | Tragic 28.1% |
| Crow | 0.0 /100 | #328 | Tragic 27.7% |
| Immigrants | Central America | 0.0 /100 | #329 | Tragic 27.5% |
| Spanish American Indians | 0.0 /100 | #330 | Tragic 27.5% |
| Immigrants | Azores | 0.0 /100 | #331 | Tragic 27.3% |
| Menominee | 0.0 /100 | #332 | Tragic 27.3% |
| Mexicans | 0.0 /100 | #333 | Tragic 27.1% |
| Arapaho | 0.0 /100 | #334 | Tragic 26.6% |
| Natives/Alaskans | 0.0 /100 | #335 | Tragic 26.3% |
| Immigrants | Mexico | 0.0 /100 | #336 | Tragic 26.1% |
| Inupiat | 0.0 /100 | #337 | Tragic 25.8% |
| Pueblo | 0.0 /100 | #338 | Tragic 25.5% |
| Hopi | 0.0 /100 | #339 | Tragic 25.3% |
| Lumbee | 0.0 /100 | #340 | Tragic 24.8% |