Immigrants from Bosnia and Herzegovina vs Immigrants from Argentina Associate's Degree
COMPARE
Immigrants from Bosnia and Herzegovina
Immigrants from Argentina
Associate's Degree
Associate's Degree Comparison
Immigrants from Bosnia and Herzegovina
Immigrants from Argentina
46.3%
ASSOCIATE'S DEGREE
48.3/ 100
METRIC RATING
178th/ 347
METRIC RANK
50.9%
ASSOCIATE'S DEGREE
99.5/ 100
METRIC RATING
70th/ 347
METRIC RANK
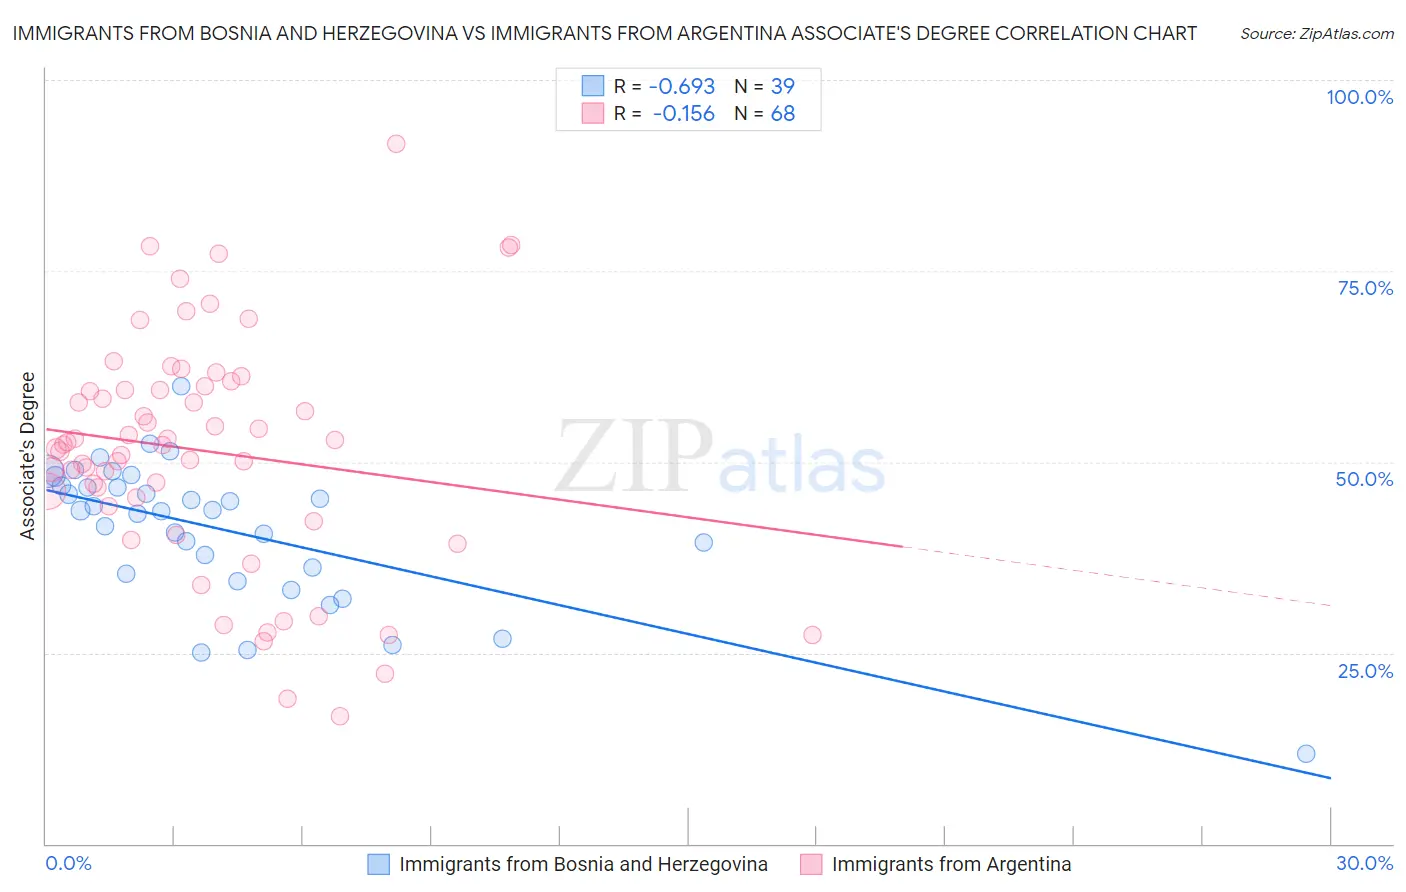
Immigrants from Bosnia and Herzegovina vs Immigrants from Argentina Associate's Degree Correlation Chart
The statistical analysis conducted on geographies consisting of 156,817,312 people shows a significant negative correlation between the proportion of Immigrants from Bosnia and Herzegovina and percentage of population with at least associate's degree education in the United States with a correlation coefficient (R) of -0.693 and weighted average of 46.3%. Similarly, the statistical analysis conducted on geographies consisting of 264,422,304 people shows a poor negative correlation between the proportion of Immigrants from Argentina and percentage of population with at least associate's degree education in the United States with a correlation coefficient (R) of -0.156 and weighted average of 50.9%, a difference of 10.0%.
Associate's Degree Correlation Summary
| Measurement | Immigrants from Bosnia and Herzegovina | Immigrants from Argentina |
| Minimum | 11.8% | 16.7% |
| Maximum | 59.9% | 91.7% |
| Range | 48.2% | 75.0% |
| Mean | 41.0% | 51.4% |
| Median | 43.6% | 52.3% |
| Interquartile 25% (IQ1) | 35.3% | 44.7% |
| Interquartile 75% (IQ3) | 46.9% | 59.7% |
| Interquartile Range (IQR) | 11.5% | 15.0% |
| Standard Deviation (Sample) | 9.4% | 15.2% |
| Standard Deviation (Population) | 9.2% | 15.1% |
Similar Demographics by Associate's Degree
Demographics Similar to Immigrants from Bosnia and Herzegovina by Associate's Degree
In terms of associate's degree, the demographic groups most similar to Immigrants from Bosnia and Herzegovina are Slovak (46.3%, a difference of 0.010%), Finnish (46.3%, a difference of 0.020%), Belgian (46.3%, a difference of 0.040%), Sri Lankan (46.3%, a difference of 0.050%), and English (46.4%, a difference of 0.13%).
| Demographics | Rating | Rank | Associate's Degree |
| Basques | 52.8 /100 | #171 | Average 46.5% |
| Peruvians | 50.5 /100 | #172 | Average 46.4% |
| Immigrants | Iraq | 50.3 /100 | #173 | Average 46.4% |
| English | 50.0 /100 | #174 | Average 46.4% |
| Belgians | 48.9 /100 | #175 | Average 46.3% |
| Finns | 48.5 /100 | #176 | Average 46.3% |
| Slovaks | 48.4 /100 | #177 | Average 46.3% |
| Immigrants | Bosnia and Herzegovina | 48.3 /100 | #178 | Average 46.3% |
| Sri Lankans | 47.6 /100 | #179 | Average 46.3% |
| Bermudans | 46.4 /100 | #180 | Average 46.2% |
| Immigrants | Colombia | 41.3 /100 | #181 | Average 46.0% |
| Swiss | 40.4 /100 | #182 | Average 46.0% |
| Yugoslavians | 40.2 /100 | #183 | Average 46.0% |
| Czechoslovakians | 40.0 /100 | #184 | Average 46.0% |
| Costa Ricans | 38.6 /100 | #185 | Fair 46.0% |
Demographics Similar to Immigrants from Argentina by Associate's Degree
In terms of associate's degree, the demographic groups most similar to Immigrants from Argentina are Immigrants from Romania (50.9%, a difference of 0.010%), Egyptian (50.9%, a difference of 0.030%), Immigrants from Pakistan (50.9%, a difference of 0.070%), Immigrants from Indonesia (51.0%, a difference of 0.15%), and Carpatho Rusyn (50.6%, a difference of 0.54%).
| Demographics | Rating | Rank | Associate's Degree |
| South Africans | 99.7 /100 | #63 | Exceptional 51.4% |
| Immigrants | Netherlands | 99.7 /100 | #64 | Exceptional 51.4% |
| Zimbabweans | 99.7 /100 | #65 | Exceptional 51.3% |
| Immigrants | Europe | 99.7 /100 | #66 | Exceptional 51.3% |
| Argentineans | 99.6 /100 | #67 | Exceptional 51.2% |
| Immigrants | Indonesia | 99.5 /100 | #68 | Exceptional 51.0% |
| Egyptians | 99.5 /100 | #69 | Exceptional 50.9% |
| Immigrants | Argentina | 99.5 /100 | #70 | Exceptional 50.9% |
| Immigrants | Romania | 99.5 /100 | #71 | Exceptional 50.9% |
| Immigrants | Pakistan | 99.5 /100 | #72 | Exceptional 50.9% |
| Carpatho Rusyns | 99.3 /100 | #73 | Exceptional 50.6% |
| Lithuanians | 99.3 /100 | #74 | Exceptional 50.6% |
| Immigrants | Scotland | 99.3 /100 | #75 | Exceptional 50.6% |
| Immigrants | Zimbabwe | 99.2 /100 | #76 | Exceptional 50.5% |
| Immigrants | Lebanon | 99.1 /100 | #77 | Exceptional 50.5% |