Immigrants from Bosnia and Herzegovina vs Albanian 8th Grade
COMPARE
Immigrants from Bosnia and Herzegovina
Albanian
8th Grade
8th Grade Comparison
Immigrants from Bosnia and Herzegovina
Albanians
96.2%
8TH GRADE
93.9/ 100
METRIC RATING
128th/ 347
METRIC RANK
96.0%
8TH GRADE
83.1/ 100
METRIC RATING
148th/ 347
METRIC RANK
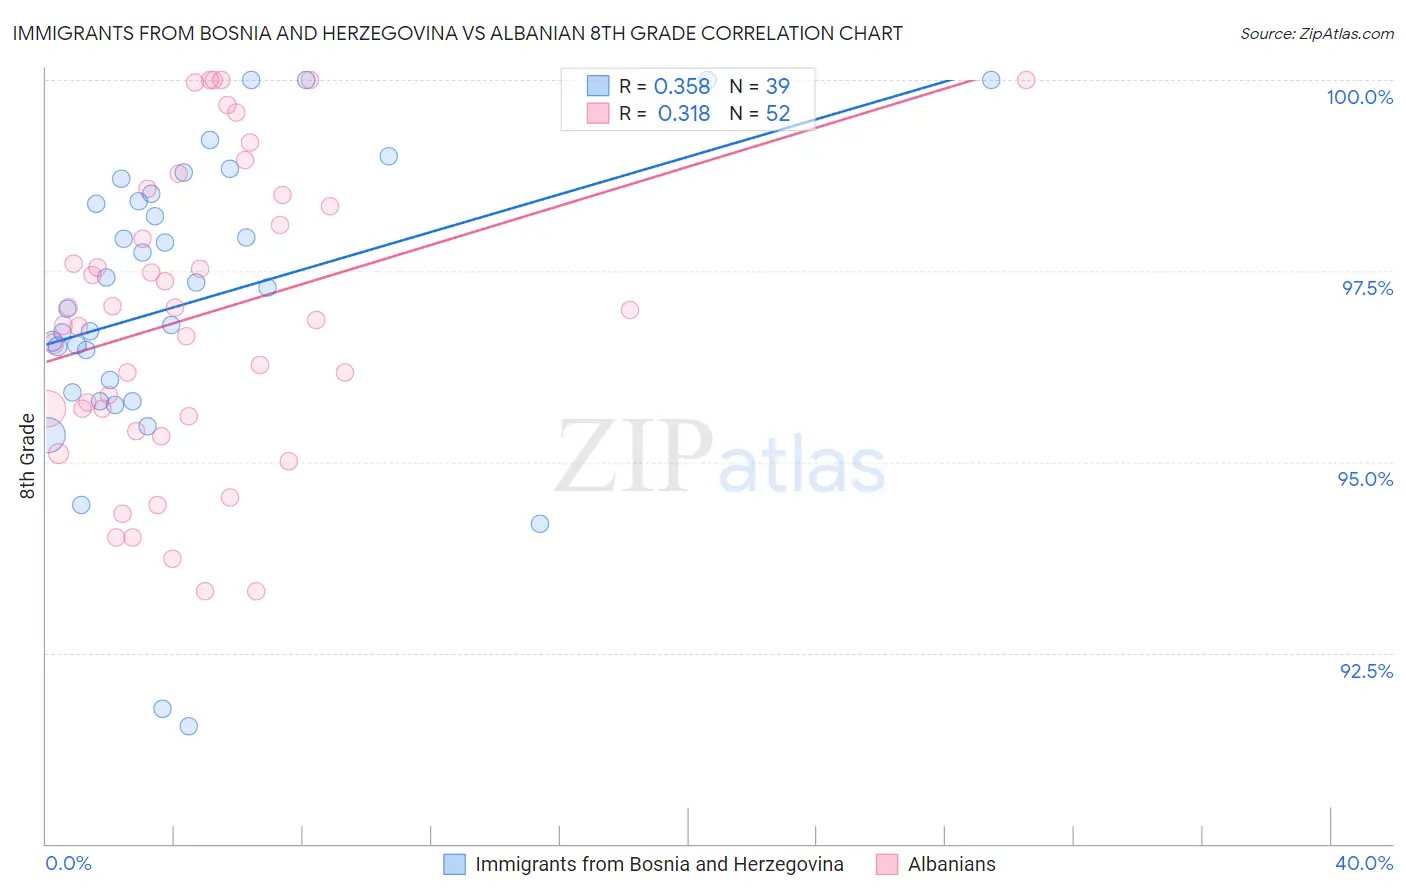
Immigrants from Bosnia and Herzegovina vs Albanian 8th Grade Correlation Chart
The statistical analysis conducted on geographies consisting of 156,779,463 people shows a mild positive correlation between the proportion of Immigrants from Bosnia and Herzegovina and percentage of population with at least 8th grade education in the United States with a correlation coefficient (R) of 0.358 and weighted average of 96.2%. Similarly, the statistical analysis conducted on geographies consisting of 193,265,850 people shows a mild positive correlation between the proportion of Albanians and percentage of population with at least 8th grade education in the United States with a correlation coefficient (R) of 0.318 and weighted average of 96.0%, a difference of 0.18%.
8th Grade Correlation Summary
| Measurement | Immigrants from Bosnia and Herzegovina | Albanian |
| Minimum | 91.5% | 93.3% |
| Maximum | 100.0% | 100.0% |
| Range | 8.5% | 6.7% |
| Mean | 97.1% | 96.9% |
| Median | 97.3% | 96.9% |
| Interquartile 25% (IQ1) | 95.9% | 95.6% |
| Interquartile 75% (IQ3) | 98.5% | 98.4% |
| Interquartile Range (IQR) | 2.6% | 2.8% |
| Standard Deviation (Sample) | 2.0% | 1.9% |
| Standard Deviation (Population) | 2.0% | 1.9% |
Demographics Similar to Immigrants from Bosnia and Herzegovina and Albanians by 8th Grade
In terms of 8th grade, the demographic groups most similar to Immigrants from Bosnia and Herzegovina are Cheyenne (96.1%, a difference of 0.010%), Soviet Union (96.1%, a difference of 0.030%), Pueblo (96.1%, a difference of 0.040%), Immigrants from Kuwait (96.1%, a difference of 0.040%), and Immigrants from Turkey (96.1%, a difference of 0.050%). Similarly, the demographic groups most similar to Albanians are Lumbee (96.0%, a difference of 0.010%), Israeli (96.0%, a difference of 0.010%), Colville (96.0%, a difference of 0.010%), Spanish (96.0%, a difference of 0.020%), and Immigrants from Belarus (96.0%, a difference of 0.020%).
| Demographics | Rating | Rank | 8th Grade |
| Immigrants | Bosnia and Herzegovina | 93.9 /100 | #128 | Exceptional 96.2% |
| Cheyenne | 93.3 /100 | #129 | Exceptional 96.1% |
| Soviet Union | 92.6 /100 | #130 | Exceptional 96.1% |
| Pueblo | 92.3 /100 | #131 | Exceptional 96.1% |
| Immigrants | Kuwait | 92.2 /100 | #132 | Exceptional 96.1% |
| Immigrants | Turkey | 91.7 /100 | #133 | Exceptional 96.1% |
| Immigrants | Hungary | 91.5 /100 | #134 | Exceptional 96.1% |
| Basques | 91.5 /100 | #135 | Exceptional 96.1% |
| Jordanians | 91.3 /100 | #136 | Exceptional 96.1% |
| Cambodians | 90.6 /100 | #137 | Exceptional 96.1% |
| Burmese | 90.2 /100 | #138 | Exceptional 96.1% |
| Hmong | 89.7 /100 | #139 | Excellent 96.1% |
| Immigrants | South Central Asia | 89.4 /100 | #140 | Excellent 96.1% |
| Immigrants | Greece | 85.9 /100 | #141 | Excellent 96.0% |
| Immigrants | Eastern Europe | 85.4 /100 | #142 | Excellent 96.0% |
| Spanish | 85.1 /100 | #143 | Excellent 96.0% |
| Immigrants | Belarus | 84.8 /100 | #144 | Excellent 96.0% |
| Lumbee | 84.1 /100 | #145 | Excellent 96.0% |
| Israelis | 84.1 /100 | #146 | Excellent 96.0% |
| Colville | 84.0 /100 | #147 | Excellent 96.0% |
| Albanians | 83.1 /100 | #148 | Excellent 96.0% |