Immigrants from Bolivia vs Slovak High School Diploma

COMPARE

Immigrants from Bolivia
Race
Ancestry
AfghanAfricanAlaska NativeAlaskan AthabascanAlbanianAleutAlsatianAmericanApacheArabArapahoArgentineanArmenianAssyrian/Chaldean/SyriacAustralianAustrianBahamianBangladeshiBarbadianBasqueBelgianBelizeanBermudanBhutaneseBlackfeetBolivianBrazilianBritishBritish West IndianBulgarianBurmeseCajunCambodianCanadianCape VerdeanCarpatho RusynCelticCentral AmericanCentral American IndianCherokeeCheyenneChickasawChileanChineseChippewaChoctawColombianColvilleComancheCosta RicanCreeCreekCroatianCrowCubanCypriotCzechCzechoslovakianDanishDelawareDominicanDutchDutch West IndianEastern EuropeanEcuadorianEgyptianEnglishEstonianEthiopianEuropeanFijianFilipinoFinnishFrenchFrench American IndianFrench CanadianGermanGerman RussianGhanaianGreekGuamanian/ChamorroGuatemalanGuyaneseHaitianHmongHonduranHopiHoumaHungarianIcelanderIndian (Asian)IndonesianInupiatIranianIraqiIrishIroquoisIsraeliItalianJamaicanJapaneseJordanianKenyanKiowaKoreanLaotianLatvianLebaneseLiberianLithuanianLumbeeLuxembourgerMacedonianMalaysianMalteseMarshalleseMenomineeMexicanMexican American IndianMongolianMoroccanNative HawaiianNavajoNepaleseNew ZealanderNicaraguanNigerianNorthern EuropeanNorwegianOkinawanOsageOttawaPaiutePakistaniPalestinianPanamanianParaguayanPennsylvania GermanPeruvianPimaPolishPortuguesePotawatomiPuebloPuerto RicanPuget Sound SalishRomanianRussianSalvadoranSamoanScandinavianScotch-IrishScottishSeminoleSenegaleseSerbianShoshoneSierra LeoneanSiouxSlavicSloveneSomaliSouth AfricanSouth AmericanSouth American IndianSoviet UnionSpaniardSpanishSpanish AmericanSpanish American IndianSri LankanSubsaharan AfricanSudaneseSwedishSwissSyrianTaiwaneseThaiTlingit-HaidaTohono O'OdhamTonganTrinidadian and TobagonianTsimshianTurkishU.S. Virgin IslanderUgandanUkrainianUruguayanUteVenezuelanVietnameseWelshWest IndianYakamaYaquiYugoslavianYumanYup'ikZimbabwean
Immigration
NonimmigrantsImmigrantsAfghanistanAfricaAlbaniaArgentinaArmeniaAsiaAustraliaAustriaBahamasBangladeshBarbadosBelarusBelgiumBelizeBoliviaBosnia and HerzegovinaBrazilBulgariaBurma/MyanmarCabo VerdeCambodiaCameroonCanadaCaribbeanCentral AmericaChileChinaColombiaCongoCosta RicaCroatiaCubaCzechoslovakiaDenmarkDominicaDominican RepublicEastern AfricaEastern AsiaEastern EuropeEcuadorEgyptEl SalvadorEnglandEritreaEthiopiaEuropeFijiFranceGermanyGhanaGreeceGrenadaGuatemalaGuyanaHaitiHondurasHong KongHungaryIndiaIndonesiaIranIraqIrelandIsraelItalyJamaicaJapanJordanKazakhstanKenyaKoreaKuwaitLaosLatin AmericaLatviaLebanonLiberiaLithuaniaMalaysiaMexicoMicronesiaMiddle AfricaMoldovaMoroccoNepalNetherlandsNicaraguaNigeriaNorth AmericaNorth MacedoniaNorthern AfricaNorthern EuropeNorwayOceaniaPakistanPanamaPeruPhilippinesPolandPortugalRomaniaRussiaSaudi ArabiaScotlandSenegalSerbiaSierra LeoneSingaporeSomaliaSouth AfricaSouth AmericaSouth Central AsiaSouth Eastern AsiaSouthern EuropeSpainSri LankaSt. Vincent and the GrenadinesSudanSwedenSwitzerlandSyriaTaiwanThailandTrinidad and TobagoTurkeyUgandaUkraineUruguayUzbekistanVenezuelaVietnamWest IndiesWestern AfricaWestern AsiaWestern EuropeYemenZaireZimbabweAzores
Slovak
Race
Ancestry
AfghanAfricanAlaska NativeAlaskan AthabascanAlbanianAleutAlsatianAmericanApacheArabArapahoArgentineanArmenianAssyrian/Chaldean/SyriacAustralianAustrianBahamianBangladeshiBarbadianBasqueBelgianBelizeanBermudanBhutaneseBlackfeetBolivianBrazilianBritishBritish West IndianBulgarianBurmeseCajunCambodianCanadianCape VerdeanCarpatho RusynCelticCentral AmericanCentral American IndianCherokeeCheyenneChickasawChileanChineseChippewaChoctawColombianColvilleComancheCosta RicanCreeCreekCroatianCrowCubanCypriotCzechCzechoslovakianDanishDelawareDominicanDutchDutch West IndianEastern EuropeanEcuadorianEgyptianEnglishEstonianEthiopianEuropeanFijianFilipinoFinnishFrenchFrench American IndianFrench CanadianGermanGerman RussianGhanaianGreekGuamanian/ChamorroGuatemalanGuyaneseHaitianHmongHonduranHopiHoumaHungarianIcelanderIndian (Asian)IndonesianInupiatIranianIraqiIrishIroquoisIsraeliItalianJamaicanJapaneseJordanianKenyanKiowaKoreanLaotianLatvianLebaneseLiberianLithuanianLumbeeLuxembourgerMacedonianMalaysianMalteseMarshalleseMenomineeMexicanMexican American IndianMongolianMoroccanNative HawaiianNavajoNepaleseNew ZealanderNicaraguanNigerianNorthern EuropeanNorwegianOkinawanOsageOttawaPaiutePakistaniPalestinianPanamanianParaguayanPennsylvania GermanPeruvianPimaPolishPortuguesePotawatomiPuebloPuerto RicanPuget Sound SalishRomanianRussianSalvadoranSamoanScandinavianScotch-IrishScottishSeminoleSenegaleseSerbianShoshoneSierra LeoneanSiouxSlavicSlovakSloveneSomaliSouth AfricanSouth AmericanSouth American IndianSoviet UnionSpaniardSpanishSpanish AmericanSpanish American IndianSri LankanSubsaharan AfricanSudaneseSwedishSwissSyrianTaiwaneseThaiTlingit-HaidaTohono O'OdhamTonganTrinidadian and TobagonianTsimshianTurkishU.S. Virgin IslanderUgandanUkrainianUruguayanUteVenezuelanVietnameseWelshWest IndianYakamaYaquiYugoslavianYumanYup'ikZimbabwean
Immigration
NonimmigrantsImmigrantsAfghanistanAfricaAlbaniaArgentinaArmeniaAsiaAustraliaAustriaBahamasBangladeshBarbadosBelarusBelgiumBelizeBosnia and HerzegovinaBrazilBulgariaBurma/MyanmarCabo VerdeCambodiaCameroonCanadaCaribbeanCentral AmericaChileChinaColombiaCongoCosta RicaCroatiaCubaCzechoslovakiaDenmarkDominicaDominican RepublicEastern AfricaEastern AsiaEastern EuropeEcuadorEgyptEl SalvadorEnglandEritreaEthiopiaEuropeFijiFranceGermanyGhanaGreeceGrenadaGuatemalaGuyanaHaitiHondurasHong KongHungaryIndiaIndonesiaIranIraqIrelandIsraelItalyJamaicaJapanJordanKazakhstanKenyaKoreaKuwaitLaosLatin AmericaLatviaLebanonLiberiaLithuaniaMalaysiaMexicoMicronesiaMiddle AfricaMoldovaMoroccoNepalNetherlandsNicaraguaNigeriaNorth AmericaNorth MacedoniaNorthern AfricaNorthern EuropeNorwayOceaniaPakistanPanamaPeruPhilippinesPolandPortugalRomaniaRussiaSaudi ArabiaScotlandSenegalSerbiaSierra LeoneSingaporeSomaliaSouth AfricaSouth AmericaSouth Central AsiaSouth Eastern AsiaSouthern EuropeSpainSri LankaSt. Vincent and the GrenadinesSudanSwedenSwitzerlandSyriaTaiwanThailandTrinidad and TobagoTurkeyUgandaUkraineUruguayUzbekistanVenezuelaVietnamWest IndiesWestern AfricaWestern AsiaWestern EuropeYemenZaireZimbabweAzores
High School Diploma
Income
Poverty
Unemployment
Labor Participation
Family Structure
Vehicle Availability
Education Level
Disability

High School Diploma Comparison

Immigrants from Bolivia

Slovaks

Poor
Exceptional
88.4%
HIGH SCHOOL DIPLOMA
10.3/ 100
METRIC RATING
218th/ 347
METRIC RANK
92.0%
HIGH SCHOOL DIPLOMA
100.0/ 100
METRIC RATING
6th/ 347
METRIC RANK

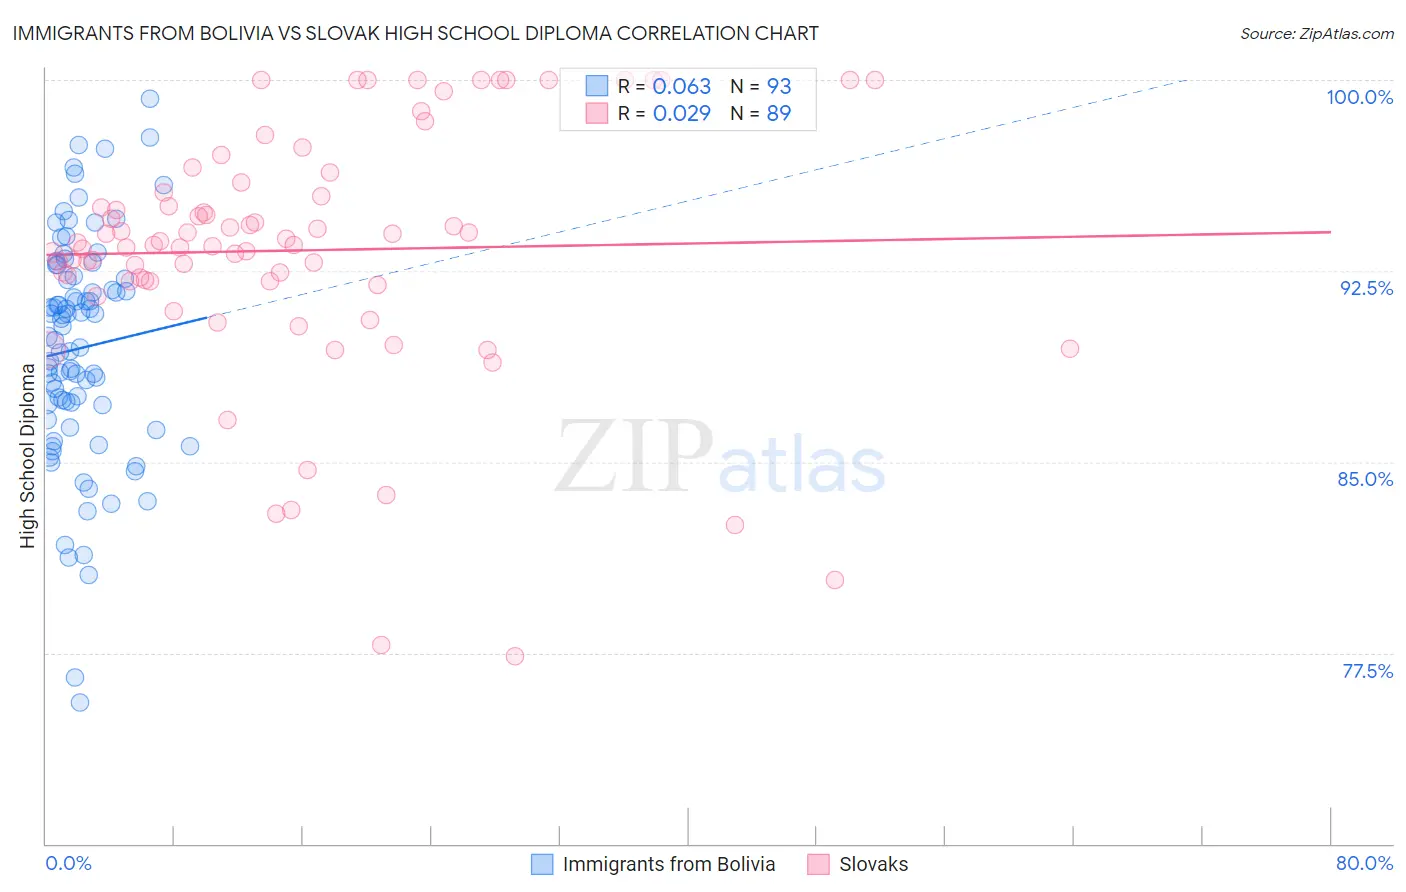
Immigrants from Bolivia vs Slovak High School Diploma Correlation Chart

The statistical analysis conducted on geographies consisting of 158,727,043 people shows a slight positive correlation between the proportion of Immigrants from Bolivia and percentage of population with at least high school diploma education in the United States with a correlation coefficient (R) of 0.063 and weighted average of 88.4%. Similarly, the statistical analysis conducted on geographies consisting of 397,891,887 people shows no correlation between the proportion of Slovaks and percentage of population with at least high school diploma education in the United States with a correlation coefficient (R) of 0.029 and weighted average of 92.0%, a difference of 4.1%.
Immigrants from Bolivia vs Slovak High School Diploma

High School Diploma Correlation Summary

MeasurementImmigrants from BoliviaSlovak
Minimum75.5%77.3%
Maximum99.3%100.0%
Range23.7%22.7%
Mean89.5%93.3%
Median89.9%93.5%
Interquartile 25% (IQ1)86.9%92.1%
Interquartile 75% (IQ3)92.3%95.8%
Interquartile Range (IQR)5.3%3.7%
Standard Deviation (Sample)4.5%4.9%
Standard Deviation (Population)4.4%4.9%

Similar Demographics by High School Diploma

Demographics Similar to Immigrants from Bolivia by High School Diploma

In terms of high school diploma, the demographic groups most similar to Immigrants from Bolivia are Immigrants from Africa (88.4%, a difference of 0.010%), Crow (88.4%, a difference of 0.020%), Chickasaw (88.4%, a difference of 0.020%), Immigrants from Cameroon (88.4%, a difference of 0.030%), and Costa Rican (88.4%, a difference of 0.030%).
DemographicsRating | RankHigh School Diploma
Inupiat
13.1
/100
|
#211
Poor
88.5%
South American Indians
12.2
/100
|
#212
Poor
88.5%
Immigrants | Somalia
11.3
/100
|
#213
Poor
88.4%
Immigrants | Cameroon
10.9
/100
|
#214
Poor
88.4%
Crow
10.9
/100
|
#215
Poor
88.4%
Chickasaw
10.7
/100
|
#216
Poor
88.4%
Immigrants | Africa
10.6
/100
|
#217
Poor
88.4%
Immigrants | Bolivia
10.3
/100
|
#218
Poor
88.4%
Costa Ricans
9.6
/100
|
#219
Tragic
88.4%
Tongans
9.5
/100
|
#220
Tragic
88.4%
Immigrants | Afghanistan
8.6
/100
|
#221
Tragic
88.3%
Colville
7.8
/100
|
#222
Tragic
88.3%
Immigrants | Zaire
7.6
/100
|
#223
Tragic
88.3%
Shoshone
7.0
/100
|
#224
Tragic
88.3%
Creek
6.9
/100
|
#225
Tragic
88.3%

Demographics Similar to Slovaks by High School Diploma

In terms of high school diploma, the demographic groups most similar to Slovaks are Immigrants from India (92.0%, a difference of 0.0%), Slovene (92.0%, a difference of 0.020%), Chinese (92.0%, a difference of 0.020%), Lithuanian (92.0%, a difference of 0.030%), and Latvian (92.0%, a difference of 0.030%).
DemographicsRating | RankHigh School Diploma
Norwegians
100.0
/100
|
#1
Exceptional
92.5%
Swedes
100.0
/100
|
#2
Exceptional
92.2%
Carpatho Rusyns
100.0
/100
|
#3
Exceptional
92.1%
Lithuanians
100.0
/100
|
#4
Exceptional
92.0%
Slovenes
100.0
/100
|
#5
Exceptional
92.0%
Slovaks
100.0
/100
|
#6
Exceptional
92.0%
Immigrants | India
100.0
/100
|
#7
Exceptional
92.0%
Chinese
100.0
/100
|
#8
Exceptional
92.0%
Latvians
100.0
/100
|
#9
Exceptional
92.0%
Croatians
100.0
/100
|
#10
Exceptional
92.0%
Eastern Europeans
100.0
/100
|
#11
Exceptional
91.9%
Poles
100.0
/100
|
#12
Exceptional
91.9%
Danes
100.0
/100
|
#13
Exceptional
91.8%
Bulgarians
100.0
/100
|
#14
Exceptional
91.8%
Luxembourgers
100.0
/100
|
#15
Exceptional
91.7%