Immigrants from Belgium vs Yuman Doctorate Degree
COMPARE
Immigrants from Belgium
Yuman
Doctorate Degree
Doctorate Degree Comparison
Immigrants from Belgium
Yuman
2.9%
DOCTORATE DEGREE
100.0/ 100
METRIC RATING
12th/ 347
METRIC RANK
1.5%
DOCTORATE DEGREE
1.1/ 100
METRIC RATING
252nd/ 347
METRIC RANK
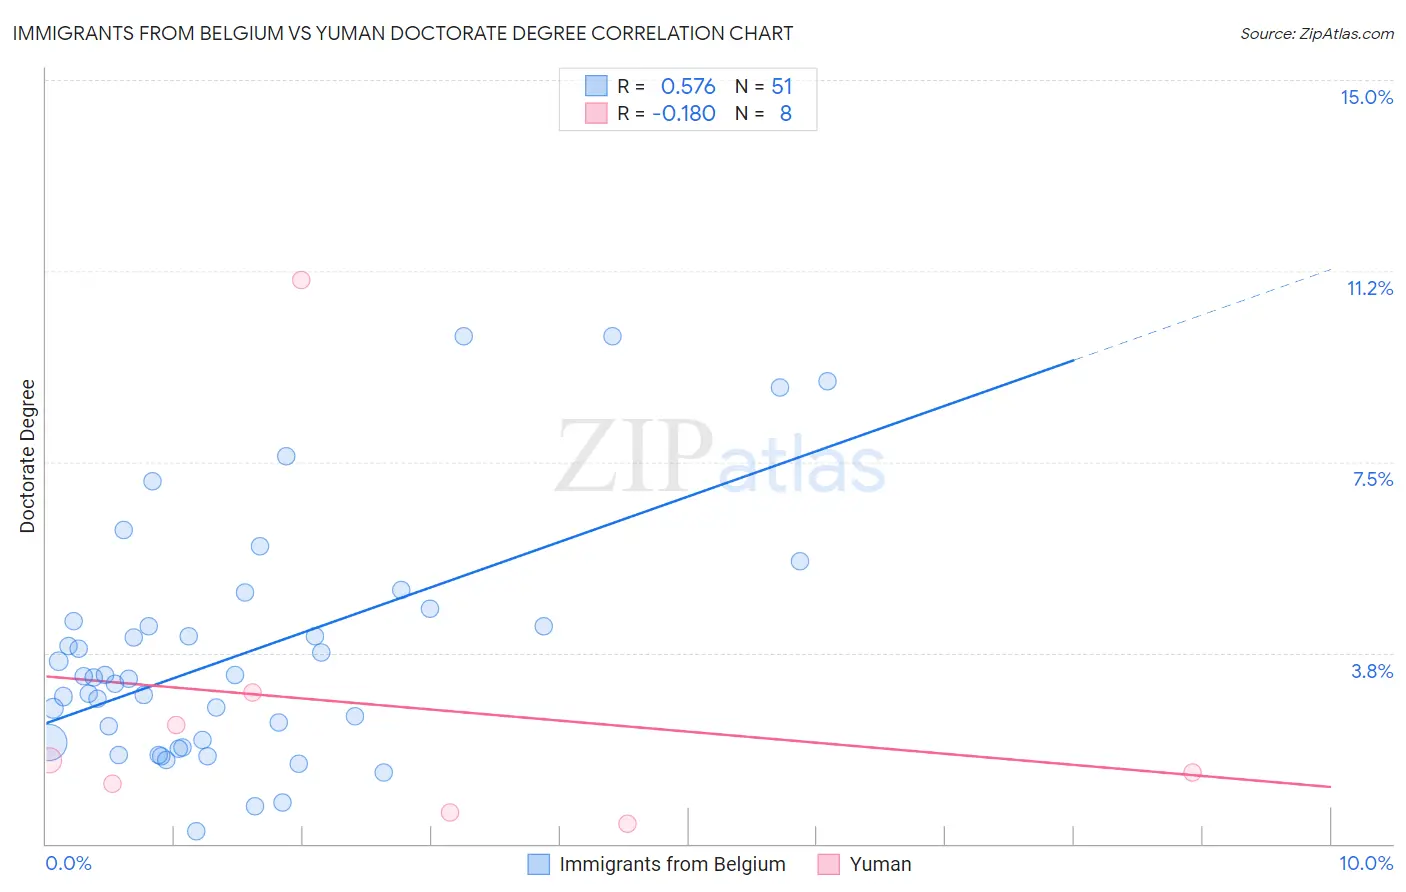
Immigrants from Belgium vs Yuman Doctorate Degree Correlation Chart
The statistical analysis conducted on geographies consisting of 146,436,412 people shows a substantial positive correlation between the proportion of Immigrants from Belgium and percentage of population with at least doctorate degree education in the United States with a correlation coefficient (R) of 0.576 and weighted average of 2.9%. Similarly, the statistical analysis conducted on geographies consisting of 40,365,852 people shows a poor negative correlation between the proportion of Yuman and percentage of population with at least doctorate degree education in the United States with a correlation coefficient (R) of -0.180 and weighted average of 1.5%, a difference of 88.6%.
Doctorate Degree Correlation Summary
| Measurement | Immigrants from Belgium | Yuman |
| Minimum | 0.23% | 0.38% |
| Maximum | 10.0% | 11.1% |
| Range | 9.7% | 10.7% |
| Mean | 3.7% | 2.7% |
| Median | 3.3% | 1.5% |
| Interquartile 25% (IQ1) | 2.0% | 0.89% |
| Interquartile 75% (IQ3) | 4.4% | 2.7% |
| Interquartile Range (IQR) | 2.4% | 1.8% |
| Standard Deviation (Sample) | 2.3% | 3.5% |
| Standard Deviation (Population) | 2.3% | 3.3% |
Similar Demographics by Doctorate Degree
Demographics Similar to Immigrants from Belgium by Doctorate Degree
In terms of doctorate degree, the demographic groups most similar to Immigrants from Belgium are Indian (Asian) (2.9%, a difference of 0.66%), Immigrants from Sweden (2.9%, a difference of 0.94%), Immigrants from France (2.9%, a difference of 0.99%), Immigrants from India (2.8%, a difference of 2.1%), and Eastern European (2.8%, a difference of 2.5%).
| Demographics | Rating | Rank | Doctorate Degree |
| Iranians | 100.0 /100 | #5 | Exceptional 3.1% |
| Immigrants | Switzerland | 100.0 /100 | #6 | Exceptional 3.1% |
| Immigrants | China | 100.0 /100 | #7 | Exceptional 3.1% |
| Immigrants | Israel | 100.0 /100 | #8 | Exceptional 3.0% |
| Immigrants | Iran | 100.0 /100 | #9 | Exceptional 3.0% |
| Immigrants | Eastern Asia | 100.0 /100 | #10 | Exceptional 3.0% |
| Indians (Asian) | 100.0 /100 | #11 | Exceptional 2.9% |
| Immigrants | Belgium | 100.0 /100 | #12 | Exceptional 2.9% |
| Immigrants | Sweden | 100.0 /100 | #13 | Exceptional 2.9% |
| Immigrants | France | 100.0 /100 | #14 | Exceptional 2.9% |
| Immigrants | India | 100.0 /100 | #15 | Exceptional 2.8% |
| Eastern Europeans | 100.0 /100 | #16 | Exceptional 2.8% |
| Immigrants | Australia | 100.0 /100 | #17 | Exceptional 2.8% |
| Immigrants | Sri Lanka | 100.0 /100 | #18 | Exceptional 2.8% |
| Immigrants | Japan | 100.0 /100 | #19 | Exceptional 2.8% |
Demographics Similar to Yuman by Doctorate Degree
In terms of doctorate degree, the demographic groups most similar to Yuman are American (1.5%, a difference of 0.15%), Immigrants from Cambodia (1.5%, a difference of 0.28%), Trinidadian and Tobagonian (1.5%, a difference of 0.28%), Central American Indian (1.5%, a difference of 0.33%), and Chippewa (1.5%, a difference of 0.55%).
| Demographics | Rating | Rank | Doctorate Degree |
| Delaware | 1.9 /100 | #245 | Tragic 1.6% |
| Hmong | 1.8 /100 | #246 | Tragic 1.6% |
| Comanche | 1.8 /100 | #247 | Tragic 1.6% |
| Africans | 1.8 /100 | #248 | Tragic 1.6% |
| Potawatomi | 1.6 /100 | #249 | Tragic 1.6% |
| Immigrants | Fiji | 1.6 /100 | #250 | Tragic 1.6% |
| Apache | 1.3 /100 | #251 | Tragic 1.5% |
| Yuman | 1.1 /100 | #252 | Tragic 1.5% |
| Americans | 1.0 /100 | #253 | Tragic 1.5% |
| Immigrants | Cambodia | 1.0 /100 | #254 | Tragic 1.5% |
| Trinidadians and Tobagonians | 1.0 /100 | #255 | Tragic 1.5% |
| Central American Indians | 1.0 /100 | #256 | Tragic 1.5% |
| Chippewa | 0.9 /100 | #257 | Tragic 1.5% |
| Immigrants | West Indies | 0.9 /100 | #258 | Tragic 1.5% |
| Liberians | 0.9 /100 | #259 | Tragic 1.5% |