Immigrants from Belgium vs Immigrants from France Nursery School
COMPARE
Immigrants from Belgium
Immigrants from France
Nursery School
Nursery School Comparison
Immigrants from Belgium
Immigrants from France
98.3%
NURSERY SCHOOL
99.3/ 100
METRIC RATING
79th/ 347
METRIC RANK
98.2%
NURSERY SCHOOL
95.6/ 100
METRIC RATING
117th/ 347
METRIC RANK
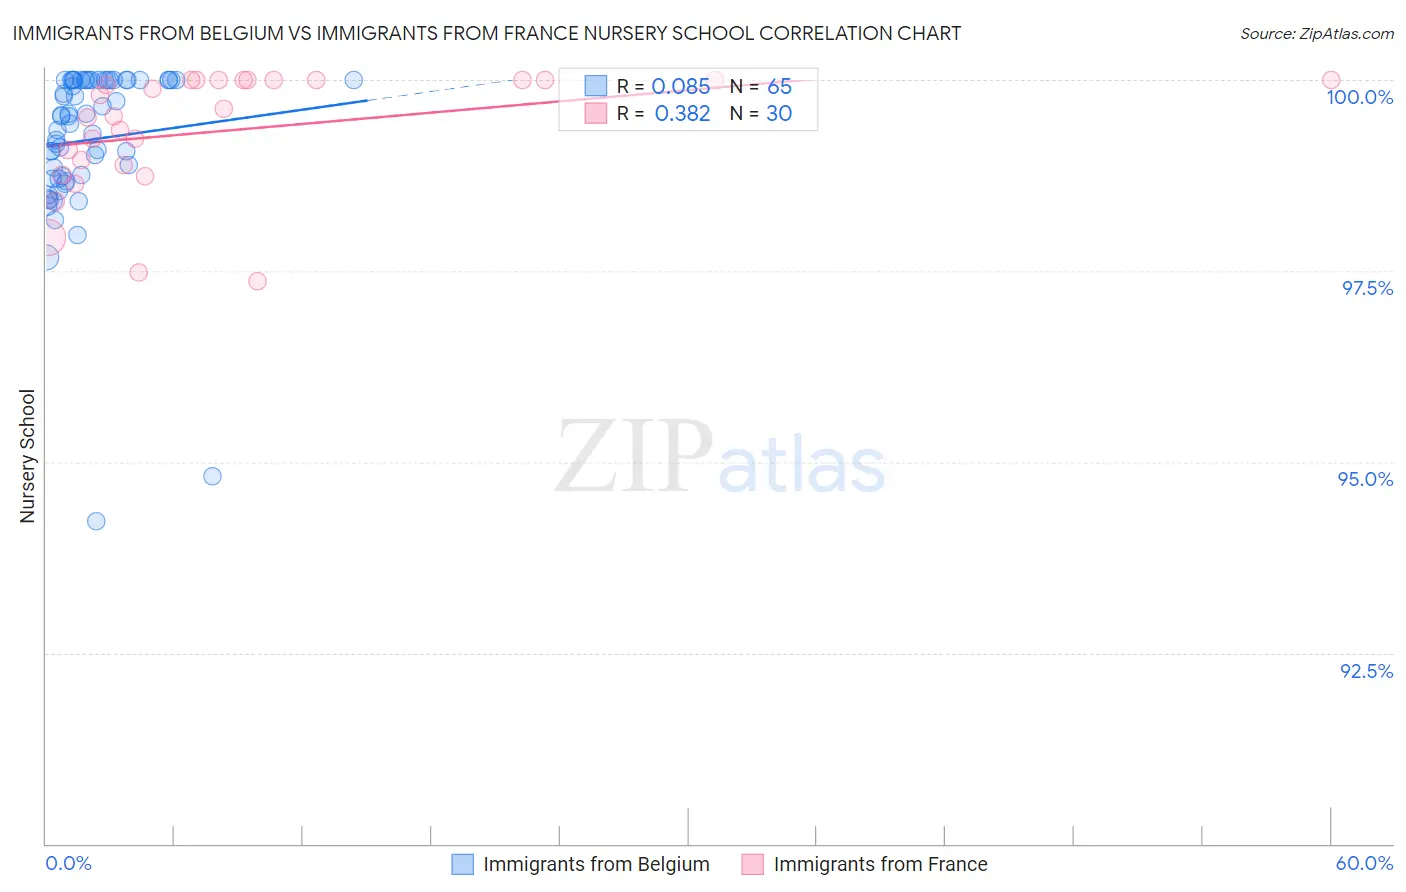
Immigrants from Belgium vs Immigrants from France Nursery School Correlation Chart
The statistical analysis conducted on geographies consisting of 146,727,969 people shows a slight positive correlation between the proportion of Immigrants from Belgium and percentage of population with at least nursery school education in the United States with a correlation coefficient (R) of 0.085 and weighted average of 98.3%. Similarly, the statistical analysis conducted on geographies consisting of 287,920,814 people shows a mild positive correlation between the proportion of Immigrants from France and percentage of population with at least nursery school education in the United States with a correlation coefficient (R) of 0.382 and weighted average of 98.2%, a difference of 0.14%.
Nursery School Correlation Summary
| Measurement | Immigrants from Belgium | Immigrants from France |
| Minimum | 94.2% | 97.4% |
| Maximum | 100.0% | 100.0% |
| Range | 5.8% | 2.6% |
| Mean | 99.2% | 99.3% |
| Median | 99.5% | 99.6% |
| Interquartile 25% (IQ1) | 98.7% | 98.9% |
| Interquartile 75% (IQ3) | 100.0% | 100.0% |
| Interquartile Range (IQR) | 1.3% | 1.1% |
| Standard Deviation (Sample) | 1.1% | 0.78% |
| Standard Deviation (Population) | 1.1% | 0.77% |
Similar Demographics by Nursery School
Demographics Similar to Immigrants from Belgium by Nursery School
In terms of nursery school, the demographic groups most similar to Immigrants from Belgium are Cherokee (98.3%, a difference of 0.0%), Immigrants from England (98.3%, a difference of 0.0%), Immigrants from Lithuania (98.3%, a difference of 0.0%), Delaware (98.3%, a difference of 0.0%), and Shoshone (98.3%, a difference of 0.0%).
| Demographics | Rating | Rank | Nursery School |
| Chickasaw | 99.6 /100 | #72 | Exceptional 98.4% |
| Cajuns | 99.4 /100 | #73 | Exceptional 98.4% |
| Immigrants | Netherlands | 99.4 /100 | #74 | Exceptional 98.4% |
| Cherokee | 99.3 /100 | #75 | Exceptional 98.3% |
| Immigrants | England | 99.3 /100 | #76 | Exceptional 98.3% |
| Immigrants | Lithuania | 99.3 /100 | #77 | Exceptional 98.3% |
| Delaware | 99.3 /100 | #78 | Exceptional 98.3% |
| Immigrants | Belgium | 99.3 /100 | #79 | Exceptional 98.3% |
| Shoshone | 99.3 /100 | #80 | Exceptional 98.3% |
| Icelanders | 99.2 /100 | #81 | Exceptional 98.3% |
| Potawatomi | 99.2 /100 | #82 | Exceptional 98.3% |
| Osage | 99.1 /100 | #83 | Exceptional 98.3% |
| Immigrants | Denmark | 99.1 /100 | #84 | Exceptional 98.3% |
| Immigrants | Sweden | 99.1 /100 | #85 | Exceptional 98.3% |
| Immigrants | Australia | 99.0 /100 | #86 | Exceptional 98.3% |
Demographics Similar to Immigrants from France by Nursery School
In terms of nursery school, the demographic groups most similar to Immigrants from France are Spanish (98.2%, a difference of 0.0%), Yugoslavian (98.2%, a difference of 0.0%), Ute (98.2%, a difference of 0.010%), Iranian (98.2%, a difference of 0.010%), and Thai (98.2%, a difference of 0.010%).
| Demographics | Rating | Rank | Nursery School |
| Immigrants | Singapore | 96.9 /100 | #110 | Exceptional 98.2% |
| Immigrants | Czechoslovakia | 96.8 /100 | #111 | Exceptional 98.2% |
| Immigrants | Norway | 96.6 /100 | #112 | Exceptional 98.2% |
| Immigrants | Latvia | 96.4 /100 | #113 | Exceptional 98.2% |
| Ute | 96.4 /100 | #114 | Exceptional 98.2% |
| Iranians | 96.3 /100 | #115 | Exceptional 98.2% |
| Spanish | 95.8 /100 | #116 | Exceptional 98.2% |
| Immigrants | France | 95.6 /100 | #117 | Exceptional 98.2% |
| Yugoslavians | 95.4 /100 | #118 | Exceptional 98.2% |
| Thais | 95.0 /100 | #119 | Exceptional 98.2% |
| Okinawans | 94.5 /100 | #120 | Exceptional 98.2% |
| Immigrants | Zimbabwe | 94.2 /100 | #121 | Exceptional 98.2% |
| Immigrants | Japan | 94.0 /100 | #122 | Exceptional 98.2% |
| Syrians | 93.9 /100 | #123 | Exceptional 98.2% |
| Lebanese | 93.8 /100 | #124 | Exceptional 98.2% |