Immigrants from Belarus vs White/Caucasian 7th Grade

COMPARE

Immigrants from Belarus
Race
Ancestry
AfghanAfricanAlaska NativeAlaskan AthabascanAlbanianAleutAlsatianAmericanApacheArabArapahoArgentineanArmenianAssyrian/Chaldean/SyriacAustralianAustrianBahamianBangladeshiBarbadianBasqueBelgianBelizeanBermudanBhutaneseBlackfeetBolivianBrazilianBritishBritish West IndianBulgarianBurmeseCajunCambodianCanadianCape VerdeanCarpatho RusynCelticCentral AmericanCentral American IndianCherokeeCheyenneChickasawChileanChineseChippewaChoctawColombianColvilleComancheCosta RicanCreeCreekCroatianCrowCubanCypriotCzechCzechoslovakianDanishDelawareDominicanDutchDutch West IndianEastern EuropeanEcuadorianEgyptianEnglishEstonianEthiopianEuropeanFijianFilipinoFinnishFrenchFrench American IndianFrench CanadianGermanGerman RussianGhanaianGreekGuamanian/ChamorroGuatemalanGuyaneseHaitianHmongHonduranHopiHoumaHungarianIcelanderIndian (Asian)IndonesianInupiatIranianIraqiIrishIroquoisIsraeliItalianJamaicanJapaneseJordanianKenyanKiowaKoreanLaotianLatvianLebaneseLiberianLithuanianLumbeeLuxembourgerMacedonianMalaysianMalteseMarshalleseMenomineeMexicanMexican American IndianMongolianMoroccanNative HawaiianNavajoNepaleseNew ZealanderNicaraguanNigerianNorthern EuropeanNorwegianOkinawanOsageOttawaPaiutePakistaniPalestinianPanamanianParaguayanPennsylvania GermanPeruvianPimaPolishPortuguesePotawatomiPuebloPuerto RicanPuget Sound SalishRomanianRussianSalvadoranSamoanScandinavianScotch-IrishScottishSeminoleSenegaleseSerbianShoshoneSierra LeoneanSiouxSlavicSlovakSloveneSomaliSouth AfricanSouth AmericanSouth American IndianSoviet UnionSpaniardSpanishSpanish AmericanSpanish American IndianSri LankanSubsaharan AfricanSudaneseSwedishSwissSyrianTaiwaneseThaiTlingit-HaidaTohono O'OdhamTonganTrinidadian and TobagonianTsimshianTurkishU.S. Virgin IslanderUgandanUkrainianUruguayanUteVenezuelanVietnameseWelshWest IndianYakamaYaquiYugoslavianYumanYup'ikZimbabwean
Immigration
NonimmigrantsImmigrantsAfghanistanAfricaAlbaniaArgentinaArmeniaAsiaAustraliaAustriaBahamasBangladeshBarbadosBelarusBelgiumBelizeBoliviaBosnia and HerzegovinaBrazilBulgariaBurma/MyanmarCabo VerdeCambodiaCameroonCanadaCaribbeanCentral AmericaChileChinaColombiaCongoCosta RicaCroatiaCubaCzechoslovakiaDenmarkDominicaDominican RepublicEastern AfricaEastern AsiaEastern EuropeEcuadorEgyptEl SalvadorEnglandEritreaEthiopiaEuropeFijiFranceGermanyGhanaGreeceGrenadaGuatemalaGuyanaHaitiHondurasHong KongHungaryIndiaIndonesiaIranIraqIrelandIsraelItalyJamaicaJapanJordanKazakhstanKenyaKoreaKuwaitLaosLatin AmericaLatviaLebanonLiberiaLithuaniaMalaysiaMexicoMicronesiaMiddle AfricaMoldovaMoroccoNepalNetherlandsNicaraguaNigeriaNorth AmericaNorth MacedoniaNorthern AfricaNorthern EuropeNorwayOceaniaPakistanPanamaPeruPhilippinesPolandPortugalRomaniaRussiaSaudi ArabiaScotlandSenegalSerbiaSierra LeoneSingaporeSomaliaSouth AfricaSouth AmericaSouth Central AsiaSouth Eastern AsiaSouthern EuropeSpainSri LankaSt. Vincent and the GrenadinesSudanSwedenSwitzerlandSyriaTaiwanThailandTrinidad and TobagoTurkeyUgandaUkraineUruguayUzbekistanVenezuelaVietnamWest IndiesWestern AfricaWestern AsiaWestern EuropeYemenZaireZimbabweAzores
White/Caucasian
Race
Ancestry
AfghanAfricanAlaska NativeAlaskan AthabascanAlbanianAleutAlsatianAmericanApacheArabArapahoArgentineanArmenianAssyrian/Chaldean/SyriacAustralianAustrianBahamianBangladeshiBarbadianBasqueBelgianBelizeanBermudanBhutaneseBlackfeetBolivianBrazilianBritishBritish West IndianBulgarianBurmeseCajunCambodianCanadianCape VerdeanCarpatho RusynCelticCentral AmericanCentral American IndianCherokeeCheyenneChickasawChileanChineseChippewaChoctawColombianColvilleComancheCosta RicanCreeCreekCroatianCrowCubanCypriotCzechCzechoslovakianDanishDelawareDominicanDutchDutch West IndianEastern EuropeanEcuadorianEgyptianEnglishEstonianEthiopianEuropeanFijianFilipinoFinnishFrenchFrench American IndianFrench CanadianGermanGerman RussianGhanaianGreekGuamanian/ChamorroGuatemalanGuyaneseHaitianHmongHonduranHopiHoumaHungarianIcelanderIndian (Asian)IndonesianInupiatIranianIraqiIrishIroquoisIsraeliItalianJamaicanJapaneseJordanianKenyanKiowaKoreanLaotianLatvianLebaneseLiberianLithuanianLumbeeLuxembourgerMacedonianMalaysianMalteseMarshalleseMenomineeMexicanMexican American IndianMongolianMoroccanNative HawaiianNavajoNepaleseNew ZealanderNicaraguanNigerianNorthern EuropeanNorwegianOkinawanOsageOttawaPaiutePakistaniPalestinianPanamanianParaguayanPennsylvania GermanPeruvianPimaPolishPortuguesePotawatomiPuebloPuerto RicanPuget Sound SalishRomanianRussianSalvadoranSamoanScandinavianScotch-IrishScottishSeminoleSenegaleseSerbianShoshoneSierra LeoneanSiouxSlavicSlovakSloveneSomaliSouth AfricanSouth AmericanSouth American IndianSoviet UnionSpaniardSpanishSpanish AmericanSpanish American IndianSri LankanSubsaharan AfricanSudaneseSwedishSwissSyrianTaiwaneseThaiTlingit-HaidaTohono O'OdhamTonganTrinidadian and TobagonianTsimshianTurkishU.S. Virgin IslanderUgandanUkrainianUruguayanUteVenezuelanVietnameseWelshWest IndianYakamaYaquiYugoslavianYumanYup'ikZimbabwean
Immigration
NonimmigrantsImmigrantsAfghanistanAfricaAlbaniaArgentinaArmeniaAsiaAustraliaAustriaBahamasBangladeshBarbadosBelgiumBelizeBoliviaBosnia and HerzegovinaBrazilBulgariaBurma/MyanmarCabo VerdeCambodiaCameroonCanadaCaribbeanCentral AmericaChileChinaColombiaCongoCosta RicaCroatiaCubaCzechoslovakiaDenmarkDominicaDominican RepublicEastern AfricaEastern AsiaEastern EuropeEcuadorEgyptEl SalvadorEnglandEritreaEthiopiaEuropeFijiFranceGermanyGhanaGreeceGrenadaGuatemalaGuyanaHaitiHondurasHong KongHungaryIndiaIndonesiaIranIraqIrelandIsraelItalyJamaicaJapanJordanKazakhstanKenyaKoreaKuwaitLaosLatin AmericaLatviaLebanonLiberiaLithuaniaMalaysiaMexicoMicronesiaMiddle AfricaMoldovaMoroccoNepalNetherlandsNicaraguaNigeriaNorth AmericaNorth MacedoniaNorthern AfricaNorthern EuropeNorwayOceaniaPakistanPanamaPeruPhilippinesPolandPortugalRomaniaRussiaSaudi ArabiaScotlandSenegalSerbiaSierra LeoneSingaporeSomaliaSouth AfricaSouth AmericaSouth Central AsiaSouth Eastern AsiaSouthern EuropeSpainSri LankaSt. Vincent and the GrenadinesSudanSwedenSwitzerlandSyriaTaiwanThailandTrinidad and TobagoTurkeyUgandaUkraineUruguayUzbekistanVenezuelaVietnamWest IndiesWestern AfricaWestern AsiaWestern EuropeYemenZaireZimbabweAzores
7th Grade
Income
Poverty
Unemployment
Labor Participation
Family Structure
Vehicle Availability
Education Level
Disability

7th Grade Comparison

Immigrants from Belarus

Whites/Caucasians

Excellent
Exceptional
96.3%
7TH GRADE
82.4/ 100
METRIC RATING
150th/ 347
METRIC RANK
97.0%
7TH GRADE
99.8/ 100
METRIC RATING
58th/ 347
METRIC RANK

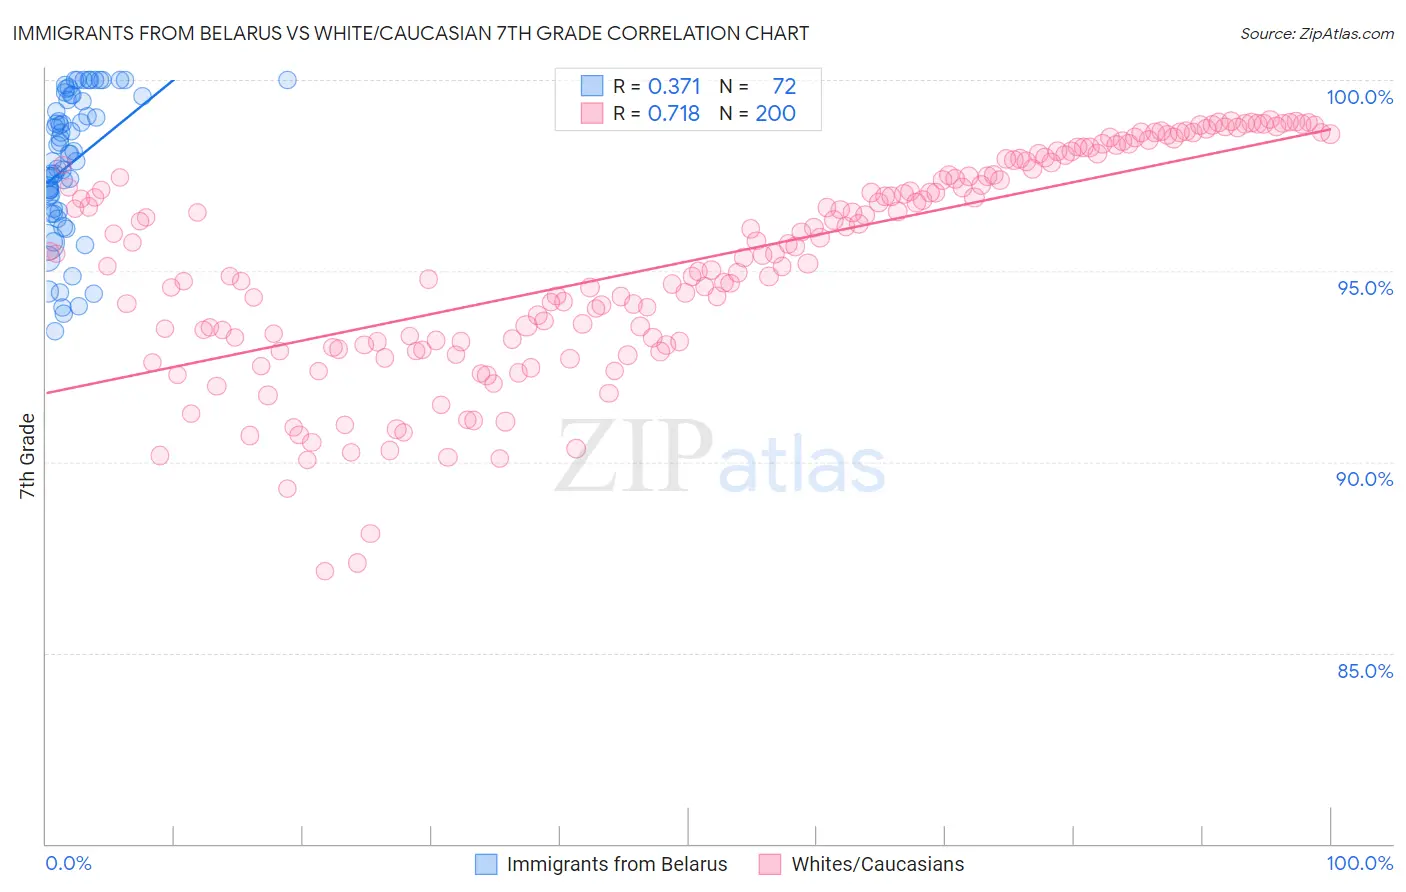
Immigrants from Belarus vs White/Caucasian 7th Grade Correlation Chart

The statistical analysis conducted on geographies consisting of 149,993,317 people shows a mild positive correlation between the proportion of Immigrants from Belarus and percentage of population with at least 7th grade education in the United States with a correlation coefficient (R) of 0.371 and weighted average of 96.3%. Similarly, the statistical analysis conducted on geographies consisting of 585,247,077 people shows a strong positive correlation between the proportion of Whites/Caucasians and percentage of population with at least 7th grade education in the United States with a correlation coefficient (R) of 0.718 and weighted average of 97.0%, a difference of 0.71%.
Immigrants from Belarus vs White/Caucasian 7th Grade

7th Grade Correlation Summary

MeasurementImmigrants from BelarusWhite/Caucasian
Minimum93.4%87.2%
Maximum100.0%99.0%
Range6.6%11.8%
Mean97.8%95.3%
Median98.1%95.5%
Interquartile 25% (IQ1)96.6%93.2%
Interquartile 75% (IQ3)99.5%97.8%
Interquartile Range (IQR)2.9%4.6%
Standard Deviation (Sample)1.8%2.8%
Standard Deviation (Population)1.8%2.8%

Similar Demographics by 7th Grade

Demographics Similar to Immigrants from Belarus by 7th Grade

In terms of 7th grade, the demographic groups most similar to Immigrants from Belarus are Israeli (96.3%, a difference of 0.0%), Albanian (96.3%, a difference of 0.0%), Immigrants from Eastern Europe (96.3%, a difference of 0.010%), French American Indian (96.3%, a difference of 0.010%), and Hopi (96.3%, a difference of 0.010%).
DemographicsRating | Rank7th Grade
Spanish
86.6
/100
|
#143
Excellent
96.3%
Immigrants | Greece
85.9
/100
|
#144
Excellent
96.3%
Blackfeet
83.9
/100
|
#145
Excellent
96.3%
Immigrants | Eastern Europe
83.7
/100
|
#146
Excellent
96.3%
French American Indians
83.1
/100
|
#147
Excellent
96.3%
Israelis
82.8
/100
|
#148
Excellent
96.3%
Albanians
82.6
/100
|
#149
Excellent
96.3%
Immigrants | Belarus
82.4
/100
|
#150
Excellent
96.3%
Hopi
81.6
/100
|
#151
Excellent
96.3%
Immigrants | Russia
78.4
/100
|
#152
Good
96.2%
Seminole
78.1
/100
|
#153
Good
96.2%
Immigrants | Israel
77.6
/100
|
#154
Good
96.2%
Immigrants | Jordan
77.0
/100
|
#155
Good
96.2%
Kenyans
76.2
/100
|
#156
Good
96.2%
Ugandans
75.5
/100
|
#157
Good
96.2%

Demographics Similar to Whites/Caucasians by 7th Grade

In terms of 7th grade, the demographic groups most similar to Whites/Caucasians are Macedonian (97.0%, a difference of 0.0%), American (97.0%, a difference of 0.010%), Immigrants from Canada (96.9%, a difference of 0.010%), Creek (96.9%, a difference of 0.010%), and Russian (97.0%, a difference of 0.020%).
DemographicsRating | Rank7th Grade
Estonians
99.9
/100
|
#51
Exceptional
97.0%
Greeks
99.9
/100
|
#52
Exceptional
97.0%
Austrians
99.8
/100
|
#53
Exceptional
97.0%
Australians
99.8
/100
|
#54
Exceptional
97.0%
Russians
99.8
/100
|
#55
Exceptional
97.0%
Serbians
99.8
/100
|
#56
Exceptional
97.0%
Americans
99.8
/100
|
#57
Exceptional
97.0%
Whites/Caucasians
99.8
/100
|
#58
Exceptional
97.0%
Macedonians
99.8
/100
|
#59
Exceptional
97.0%
Immigrants | Canada
99.8
/100
|
#60
Exceptional
96.9%
Creek
99.8
/100
|
#61
Exceptional
96.9%
Immigrants | North America
99.8
/100
|
#62
Exceptional
96.9%
Immigrants | Northern Europe
99.7
/100
|
#63
Exceptional
96.9%
Immigrants | Austria
99.7
/100
|
#64
Exceptional
96.9%
Canadians
99.7
/100
|
#65
Exceptional
96.9%