Immigrants from Belarus vs Immigrants from Czechoslovakia 11th Grade

COMPARE

Immigrants from Belarus
Race
Ancestry
AfghanAfricanAlaska NativeAlaskan AthabascanAlbanianAleutAlsatianAmericanApacheArabArapahoArgentineanArmenianAssyrian/Chaldean/SyriacAustralianAustrianBahamianBangladeshiBarbadianBasqueBelgianBelizeanBermudanBhutaneseBlackfeetBolivianBrazilianBritishBritish West IndianBulgarianBurmeseCajunCambodianCanadianCape VerdeanCarpatho RusynCelticCentral AmericanCentral American IndianCherokeeCheyenneChickasawChileanChineseChippewaChoctawColombianColvilleComancheCosta RicanCreeCreekCroatianCrowCubanCypriotCzechCzechoslovakianDanishDelawareDominicanDutchDutch West IndianEastern EuropeanEcuadorianEgyptianEnglishEstonianEthiopianEuropeanFijianFilipinoFinnishFrenchFrench American IndianFrench CanadianGermanGerman RussianGhanaianGreekGuamanian/ChamorroGuatemalanGuyaneseHaitianHmongHonduranHopiHoumaHungarianIcelanderIndian (Asian)IndonesianInupiatIranianIraqiIrishIroquoisIsraeliItalianJamaicanJapaneseJordanianKenyanKiowaKoreanLaotianLatvianLebaneseLiberianLithuanianLumbeeLuxembourgerMacedonianMalaysianMalteseMarshalleseMenomineeMexicanMexican American IndianMongolianMoroccanNative HawaiianNavajoNepaleseNew ZealanderNicaraguanNigerianNorthern EuropeanNorwegianOkinawanOsageOttawaPaiutePakistaniPalestinianPanamanianParaguayanPennsylvania GermanPeruvianPimaPolishPortuguesePotawatomiPuebloPuerto RicanPuget Sound SalishRomanianRussianSalvadoranSamoanScandinavianScotch-IrishScottishSeminoleSenegaleseSerbianShoshoneSierra LeoneanSiouxSlavicSlovakSloveneSomaliSouth AfricanSouth AmericanSouth American IndianSoviet UnionSpaniardSpanishSpanish AmericanSpanish American IndianSri LankanSubsaharan AfricanSudaneseSwedishSwissSyrianTaiwaneseThaiTlingit-HaidaTohono O'OdhamTonganTrinidadian and TobagonianTsimshianTurkishU.S. Virgin IslanderUgandanUkrainianUruguayanUteVenezuelanVietnameseWelshWest IndianYakamaYaquiYugoslavianYumanYup'ikZimbabwean
Immigration
NonimmigrantsImmigrantsAfghanistanAfricaAlbaniaArgentinaArmeniaAsiaAustraliaAustriaBahamasBangladeshBarbadosBelarusBelgiumBelizeBoliviaBosnia and HerzegovinaBrazilBulgariaBurma/MyanmarCabo VerdeCambodiaCameroonCanadaCaribbeanCentral AmericaChileChinaColombiaCongoCosta RicaCroatiaCubaDenmarkDominicaDominican RepublicEastern AfricaEastern AsiaEastern EuropeEcuadorEgyptEl SalvadorEnglandEritreaEthiopiaEuropeFijiFranceGermanyGhanaGreeceGrenadaGuatemalaGuyanaHaitiHondurasHong KongHungaryIndiaIndonesiaIranIraqIrelandIsraelItalyJamaicaJapanJordanKazakhstanKenyaKoreaKuwaitLaosLatin AmericaLatviaLebanonLiberiaLithuaniaMalaysiaMexicoMicronesiaMiddle AfricaMoldovaMoroccoNepalNetherlandsNicaraguaNigeriaNorth AmericaNorth MacedoniaNorthern AfricaNorthern EuropeNorwayOceaniaPakistanPanamaPeruPhilippinesPolandPortugalRomaniaRussiaSaudi ArabiaScotlandSenegalSerbiaSierra LeoneSingaporeSomaliaSouth AfricaSouth AmericaSouth Central AsiaSouth Eastern AsiaSouthern EuropeSpainSri LankaSt. Vincent and the GrenadinesSudanSwedenSwitzerlandSyriaTaiwanThailandTrinidad and TobagoTurkeyUgandaUkraineUruguayUzbekistanVenezuelaVietnamWest IndiesWestern AfricaWestern AsiaWestern EuropeYemenZaireZimbabweAzores
Immigrants from Czechoslovakia
Race
Ancestry
AfghanAfricanAlaska NativeAlaskan AthabascanAlbanianAleutAlsatianAmericanApacheArabArapahoArgentineanArmenianAssyrian/Chaldean/SyriacAustralianAustrianBahamianBangladeshiBarbadianBasqueBelgianBelizeanBermudanBhutaneseBlackfeetBolivianBrazilianBritishBritish West IndianBulgarianBurmeseCajunCambodianCanadianCape VerdeanCarpatho RusynCelticCentral AmericanCentral American IndianCherokeeCheyenneChickasawChileanChineseChippewaChoctawColombianColvilleComancheCosta RicanCreeCreekCroatianCrowCubanCypriotCzechCzechoslovakianDanishDelawareDominicanDutchDutch West IndianEastern EuropeanEcuadorianEgyptianEnglishEstonianEthiopianEuropeanFijianFilipinoFinnishFrenchFrench American IndianFrench CanadianGermanGerman RussianGhanaianGreekGuamanian/ChamorroGuatemalanGuyaneseHaitianHmongHonduranHopiHoumaHungarianIcelanderIndian (Asian)IndonesianInupiatIranianIraqiIrishIroquoisIsraeliItalianJamaicanJapaneseJordanianKenyanKiowaKoreanLaotianLatvianLebaneseLiberianLithuanianLumbeeLuxembourgerMacedonianMalaysianMalteseMarshalleseMenomineeMexicanMexican American IndianMongolianMoroccanNative HawaiianNavajoNepaleseNew ZealanderNicaraguanNigerianNorthern EuropeanNorwegianOkinawanOsageOttawaPaiutePakistaniPalestinianPanamanianParaguayanPennsylvania GermanPeruvianPimaPolishPortuguesePotawatomiPuebloPuerto RicanPuget Sound SalishRomanianRussianSalvadoranSamoanScandinavianScotch-IrishScottishSeminoleSenegaleseSerbianShoshoneSierra LeoneanSiouxSlavicSlovakSloveneSomaliSouth AfricanSouth AmericanSouth American IndianSoviet UnionSpaniardSpanishSpanish AmericanSpanish American IndianSri LankanSubsaharan AfricanSudaneseSwedishSwissSyrianTaiwaneseThaiTlingit-HaidaTohono O'OdhamTonganTrinidadian and TobagonianTsimshianTurkishU.S. Virgin IslanderUgandanUkrainianUruguayanUteVenezuelanVietnameseWelshWest IndianYakamaYaquiYugoslavianYumanYup'ikZimbabwean
Immigration
NonimmigrantsImmigrantsAfghanistanAfricaAlbaniaArgentinaArmeniaAsiaAustraliaAustriaBahamasBangladeshBarbadosBelgiumBelizeBoliviaBosnia and HerzegovinaBrazilBulgariaBurma/MyanmarCabo VerdeCambodiaCameroonCanadaCaribbeanCentral AmericaChileChinaColombiaCongoCosta RicaCroatiaCubaCzechoslovakiaDenmarkDominicaDominican RepublicEastern AfricaEastern AsiaEastern EuropeEcuadorEgyptEl SalvadorEnglandEritreaEthiopiaEuropeFijiFranceGermanyGhanaGreeceGrenadaGuatemalaGuyanaHaitiHondurasHong KongHungaryIndiaIndonesiaIranIraqIrelandIsraelItalyJamaicaJapanJordanKazakhstanKenyaKoreaKuwaitLaosLatin AmericaLatviaLebanonLiberiaLithuaniaMalaysiaMexicoMicronesiaMiddle AfricaMoldovaMoroccoNepalNetherlandsNicaraguaNigeriaNorth AmericaNorth MacedoniaNorthern AfricaNorthern EuropeNorwayOceaniaPakistanPanamaPeruPhilippinesPolandPortugalRomaniaRussiaSaudi ArabiaScotlandSenegalSerbiaSierra LeoneSingaporeSomaliaSouth AfricaSouth AmericaSouth Central AsiaSouth Eastern AsiaSouthern EuropeSpainSri LankaSt. Vincent and the GrenadinesSudanSwedenSwitzerlandSyriaTaiwanThailandTrinidad and TobagoTurkeyUgandaUkraineUruguayUzbekistanVenezuelaVietnamWest IndiesWestern AfricaWestern AsiaWestern EuropeYemenZaireZimbabweAzores
11th Grade
Income
Poverty
Unemployment
Labor Participation
Family Structure
Vehicle Availability
Education Level
Disability

11th Grade Comparison

Immigrants from Belarus

Immigrants from Czechoslovakia

Exceptional
Exceptional
93.3%
11TH GRADE
96.3/ 100
METRIC RATING
122nd/ 347
METRIC RANK
93.8%
11TH GRADE
99.6/ 100
METRIC RATING
74th/ 347
METRIC RANK

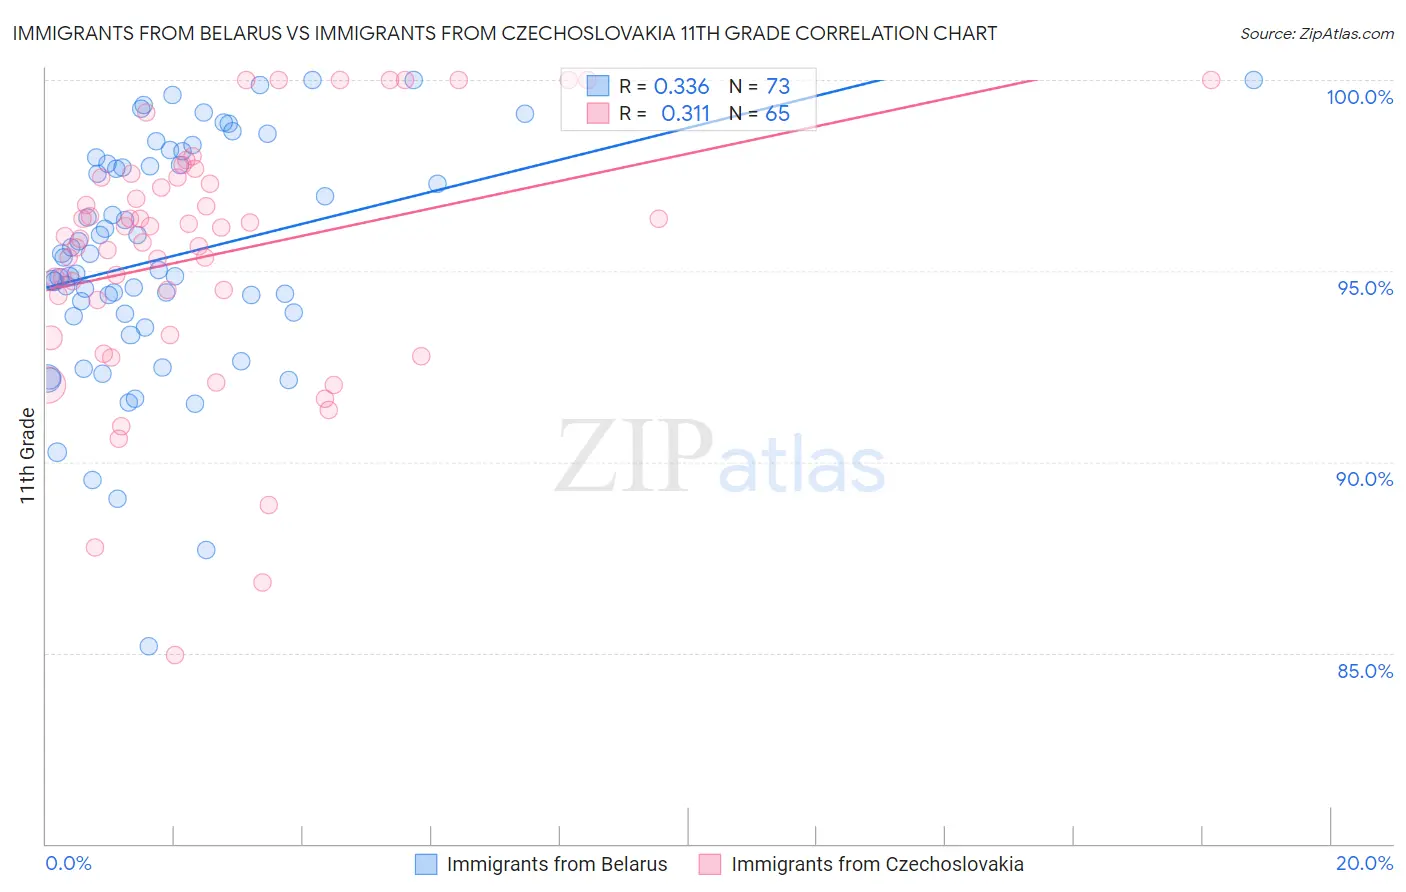
Immigrants from Belarus vs Immigrants from Czechoslovakia 11th Grade Correlation Chart

The statistical analysis conducted on geographies consisting of 150,125,045 people shows a mild positive correlation between the proportion of Immigrants from Belarus and percentage of population with at least 11th grade education in the United States with a correlation coefficient (R) of 0.336 and weighted average of 93.3%. Similarly, the statistical analysis conducted on geographies consisting of 195,448,106 people shows a mild positive correlation between the proportion of Immigrants from Czechoslovakia and percentage of population with at least 11th grade education in the United States with a correlation coefficient (R) of 0.311 and weighted average of 93.8%, a difference of 0.56%.
Immigrants from Belarus vs Immigrants from Czechoslovakia 11th Grade

11th Grade Correlation Summary

MeasurementImmigrants from BelarusImmigrants from Czechoslovakia
Minimum85.2%84.9%
Maximum100.0%100.0%
Range14.8%15.1%
Mean95.4%95.4%
Median95.3%95.9%
Interquartile 25% (IQ1)93.8%93.8%
Interquartile 75% (IQ3)97.9%97.4%
Interquartile Range (IQR)4.1%3.7%
Standard Deviation (Sample)3.1%3.3%
Standard Deviation (Population)3.1%3.3%

Similar Demographics by 11th Grade

Demographics Similar to Immigrants from Belarus by 11th Grade

In terms of 11th grade, the demographic groups most similar to Immigrants from Belarus are German Russian (93.3%, a difference of 0.0%), Immigrants from Russia (93.3%, a difference of 0.020%), Immigrants from Greece (93.2%, a difference of 0.030%), Immigrants from Eastern Europe (93.2%, a difference of 0.030%), and Immigrants from Sri Lanka (93.2%, a difference of 0.040%).
DemographicsRating | Rank11th Grade
Palestinians
97.7
/100
|
#115
Exceptional
93.4%
Immigrants | Hungary
97.5
/100
|
#116
Exceptional
93.4%
Whites/Caucasians
97.4
/100
|
#117
Exceptional
93.3%
Immigrants | Korea
97.0
/100
|
#118
Exceptional
93.3%
Israelis
97.0
/100
|
#119
Exceptional
93.3%
Immigrants | Russia
96.6
/100
|
#120
Exceptional
93.3%
German Russians
96.4
/100
|
#121
Exceptional
93.3%
Immigrants | Belarus
96.3
/100
|
#122
Exceptional
93.3%
Immigrants | Greece
95.9
/100
|
#123
Exceptional
93.2%
Immigrants | Eastern Europe
95.9
/100
|
#124
Exceptional
93.2%
Immigrants | Sri Lanka
95.6
/100
|
#125
Exceptional
93.2%
Basques
95.2
/100
|
#126
Exceptional
93.2%
Immigrants | Kazakhstan
92.4
/100
|
#127
Exceptional
93.1%
Immigrants | Jordan
92.4
/100
|
#128
Exceptional
93.1%
Immigrants | Ukraine
89.8
/100
|
#129
Excellent
93.0%

Demographics Similar to Immigrants from Czechoslovakia by 11th Grade

In terms of 11th grade, the demographic groups most similar to Immigrants from Czechoslovakia are Romanian (93.8%, a difference of 0.0%), Immigrants from Japan (93.8%, a difference of 0.020%), Immigrants from Latvia (93.8%, a difference of 0.020%), Immigrants from South Africa (93.8%, a difference of 0.050%), and Celtic (93.7%, a difference of 0.050%).
DemographicsRating | Rank11th Grade
Immigrants | Netherlands
99.8
/100
|
#67
Exceptional
93.9%
Zimbabweans
99.8
/100
|
#68
Exceptional
93.9%
Scotch-Irish
99.8
/100
|
#69
Exceptional
93.9%
Immigrants | England
99.7
/100
|
#70
Exceptional
93.8%
Immigrants | South Africa
99.7
/100
|
#71
Exceptional
93.8%
Immigrants | Japan
99.7
/100
|
#72
Exceptional
93.8%
Romanians
99.6
/100
|
#73
Exceptional
93.8%
Immigrants | Czechoslovakia
99.6
/100
|
#74
Exceptional
93.8%
Immigrants | Latvia
99.6
/100
|
#75
Exceptional
93.8%
Celtics
99.5
/100
|
#76
Exceptional
93.7%
Aleuts
99.5
/100
|
#77
Exceptional
93.7%
Soviet Union
99.5
/100
|
#78
Exceptional
93.7%
Immigrants | Denmark
99.5
/100
|
#79
Exceptional
93.7%
Canadians
99.5
/100
|
#80
Exceptional
93.7%
Immigrants | Moldova
99.5
/100
|
#81
Exceptional
93.7%