Immigrants from Barbados vs Immigrants from Netherlands 4th Grade

COMPARE

Immigrants from Barbados
Race
Ancestry
AfghanAfricanAlaska NativeAlaskan AthabascanAlbanianAleutAlsatianAmericanApacheArabArapahoArgentineanArmenianAssyrian/Chaldean/SyriacAustralianAustrianBahamianBangladeshiBarbadianBasqueBelgianBelizeanBermudanBhutaneseBlackfeetBolivianBrazilianBritishBritish West IndianBulgarianBurmeseCajunCambodianCanadianCape VerdeanCarpatho RusynCelticCentral AmericanCentral American IndianCherokeeCheyenneChickasawChileanChineseChippewaChoctawColombianColvilleComancheCosta RicanCreeCreekCroatianCrowCubanCypriotCzechCzechoslovakianDanishDelawareDominicanDutchDutch West IndianEastern EuropeanEcuadorianEgyptianEnglishEstonianEthiopianEuropeanFijianFilipinoFinnishFrenchFrench American IndianFrench CanadianGermanGerman RussianGhanaianGreekGuamanian/ChamorroGuatemalanGuyaneseHaitianHmongHonduranHopiHoumaHungarianIcelanderIndian (Asian)IndonesianInupiatIranianIraqiIrishIroquoisIsraeliItalianJamaicanJapaneseJordanianKenyanKiowaKoreanLaotianLatvianLebaneseLiberianLithuanianLumbeeLuxembourgerMacedonianMalaysianMalteseMarshalleseMenomineeMexicanMexican American IndianMongolianMoroccanNative HawaiianNavajoNepaleseNew ZealanderNicaraguanNigerianNorthern EuropeanNorwegianOkinawanOsageOttawaPaiutePakistaniPalestinianPanamanianParaguayanPennsylvania GermanPeruvianPimaPolishPortuguesePotawatomiPuebloPuerto RicanPuget Sound SalishRomanianRussianSalvadoranSamoanScandinavianScotch-IrishScottishSeminoleSenegaleseSerbianShoshoneSierra LeoneanSiouxSlavicSlovakSloveneSomaliSouth AfricanSouth AmericanSouth American IndianSoviet UnionSpaniardSpanishSpanish AmericanSpanish American IndianSri LankanSubsaharan AfricanSudaneseSwedishSwissSyrianTaiwaneseThaiTlingit-HaidaTohono O'OdhamTonganTrinidadian and TobagonianTsimshianTurkishU.S. Virgin IslanderUgandanUkrainianUruguayanUteVenezuelanVietnameseWelshWest IndianYakamaYaquiYugoslavianYumanYup'ikZimbabwean
Immigration
NonimmigrantsImmigrantsAfghanistanAfricaAlbaniaArgentinaArmeniaAsiaAustraliaAustriaBahamasBangladeshBarbadosBelarusBelgiumBelizeBoliviaBosnia and HerzegovinaBrazilBulgariaBurma/MyanmarCabo VerdeCambodiaCameroonCanadaCaribbeanCentral AmericaChileChinaColombiaCongoCosta RicaCroatiaCubaCzechoslovakiaDenmarkDominicaDominican RepublicEastern AfricaEastern AsiaEastern EuropeEcuadorEgyptEl SalvadorEnglandEritreaEthiopiaEuropeFijiFranceGermanyGhanaGreeceGrenadaGuatemalaGuyanaHaitiHondurasHong KongHungaryIndiaIndonesiaIranIraqIrelandIsraelItalyJamaicaJapanJordanKazakhstanKenyaKoreaKuwaitLaosLatin AmericaLatviaLebanonLiberiaLithuaniaMalaysiaMexicoMicronesiaMiddle AfricaMoldovaMoroccoNepalNicaraguaNigeriaNorth AmericaNorth MacedoniaNorthern AfricaNorthern EuropeNorwayOceaniaPakistanPanamaPeruPhilippinesPolandPortugalRomaniaRussiaSaudi ArabiaScotlandSenegalSerbiaSierra LeoneSingaporeSomaliaSouth AfricaSouth AmericaSouth Central AsiaSouth Eastern AsiaSouthern EuropeSpainSri LankaSt. Vincent and the GrenadinesSudanSwedenSwitzerlandSyriaTaiwanThailandTrinidad and TobagoTurkeyUgandaUkraineUruguayUzbekistanVenezuelaVietnamWest IndiesWestern AfricaWestern AsiaWestern EuropeYemenZaireZimbabweAzores
Immigrants from Netherlands
Race
Ancestry
AfghanAfricanAlaska NativeAlaskan AthabascanAlbanianAleutAlsatianAmericanApacheArabArapahoArgentineanArmenianAssyrian/Chaldean/SyriacAustralianAustrianBahamianBangladeshiBarbadianBasqueBelgianBelizeanBermudanBhutaneseBlackfeetBolivianBrazilianBritishBritish West IndianBulgarianBurmeseCajunCambodianCanadianCape VerdeanCarpatho RusynCelticCentral AmericanCentral American IndianCherokeeCheyenneChickasawChileanChineseChippewaChoctawColombianColvilleComancheCosta RicanCreeCreekCroatianCrowCubanCypriotCzechCzechoslovakianDanishDelawareDominicanDutchDutch West IndianEastern EuropeanEcuadorianEgyptianEnglishEstonianEthiopianEuropeanFijianFilipinoFinnishFrenchFrench American IndianFrench CanadianGermanGerman RussianGhanaianGreekGuamanian/ChamorroGuatemalanGuyaneseHaitianHmongHonduranHopiHoumaHungarianIcelanderIndian (Asian)IndonesianInupiatIranianIraqiIrishIroquoisIsraeliItalianJamaicanJapaneseJordanianKenyanKiowaKoreanLaotianLatvianLebaneseLiberianLithuanianLumbeeLuxembourgerMacedonianMalaysianMalteseMarshalleseMenomineeMexicanMexican American IndianMongolianMoroccanNative HawaiianNavajoNepaleseNew ZealanderNicaraguanNigerianNorthern EuropeanNorwegianOkinawanOsageOttawaPaiutePakistaniPalestinianPanamanianParaguayanPennsylvania GermanPeruvianPimaPolishPortuguesePotawatomiPuebloPuerto RicanPuget Sound SalishRomanianRussianSalvadoranSamoanScandinavianScotch-IrishScottishSeminoleSenegaleseSerbianShoshoneSierra LeoneanSiouxSlavicSlovakSloveneSomaliSouth AfricanSouth AmericanSouth American IndianSoviet UnionSpaniardSpanishSpanish AmericanSpanish American IndianSri LankanSubsaharan AfricanSudaneseSwedishSwissSyrianTaiwaneseThaiTlingit-HaidaTohono O'OdhamTonganTrinidadian and TobagonianTsimshianTurkishU.S. Virgin IslanderUgandanUkrainianUruguayanUteVenezuelanVietnameseWelshWest IndianYakamaYaquiYugoslavianYumanYup'ikZimbabwean
Immigration
NonimmigrantsImmigrantsAfghanistanAfricaAlbaniaArgentinaArmeniaAsiaAustraliaAustriaBahamasBangladeshBelarusBelgiumBelizeBoliviaBosnia and HerzegovinaBrazilBulgariaBurma/MyanmarCabo VerdeCambodiaCameroonCanadaCaribbeanCentral AmericaChileChinaColombiaCongoCosta RicaCroatiaCubaCzechoslovakiaDenmarkDominicaDominican RepublicEastern AfricaEastern AsiaEastern EuropeEcuadorEgyptEl SalvadorEnglandEritreaEthiopiaEuropeFijiFranceGermanyGhanaGreeceGrenadaGuatemalaGuyanaHaitiHondurasHong KongHungaryIndiaIndonesiaIranIraqIrelandIsraelItalyJamaicaJapanJordanKazakhstanKenyaKoreaKuwaitLaosLatin AmericaLatviaLebanonLiberiaLithuaniaMalaysiaMexicoMicronesiaMiddle AfricaMoldovaMoroccoNepalNetherlandsNicaraguaNigeriaNorth AmericaNorth MacedoniaNorthern AfricaNorthern EuropeNorwayOceaniaPakistanPanamaPeruPhilippinesPolandPortugalRomaniaRussiaSaudi ArabiaScotlandSenegalSerbiaSierra LeoneSingaporeSomaliaSouth AfricaSouth AmericaSouth Central AsiaSouth Eastern AsiaSouthern EuropeSpainSri LankaSt. Vincent and the GrenadinesSudanSwedenSwitzerlandSyriaTaiwanThailandTrinidad and TobagoTurkeyUgandaUkraineUruguayUzbekistanVenezuelaVietnamWest IndiesWestern AfricaWestern AsiaWestern EuropeYemenZaireZimbabweAzores
4th Grade
Income
Poverty
Unemployment
Labor Participation
Family Structure
Vehicle Availability
Education Level
Disability

4th Grade Comparison

Immigrants from Barbados

Immigrants from Netherlands

Tragic
Exceptional
96.8%
4TH GRADE
0.0/ 100
METRIC RATING
285th/ 347
METRIC RANK
98.0%
4TH GRADE
99.3/ 100
METRIC RATING
75th/ 347
METRIC RANK

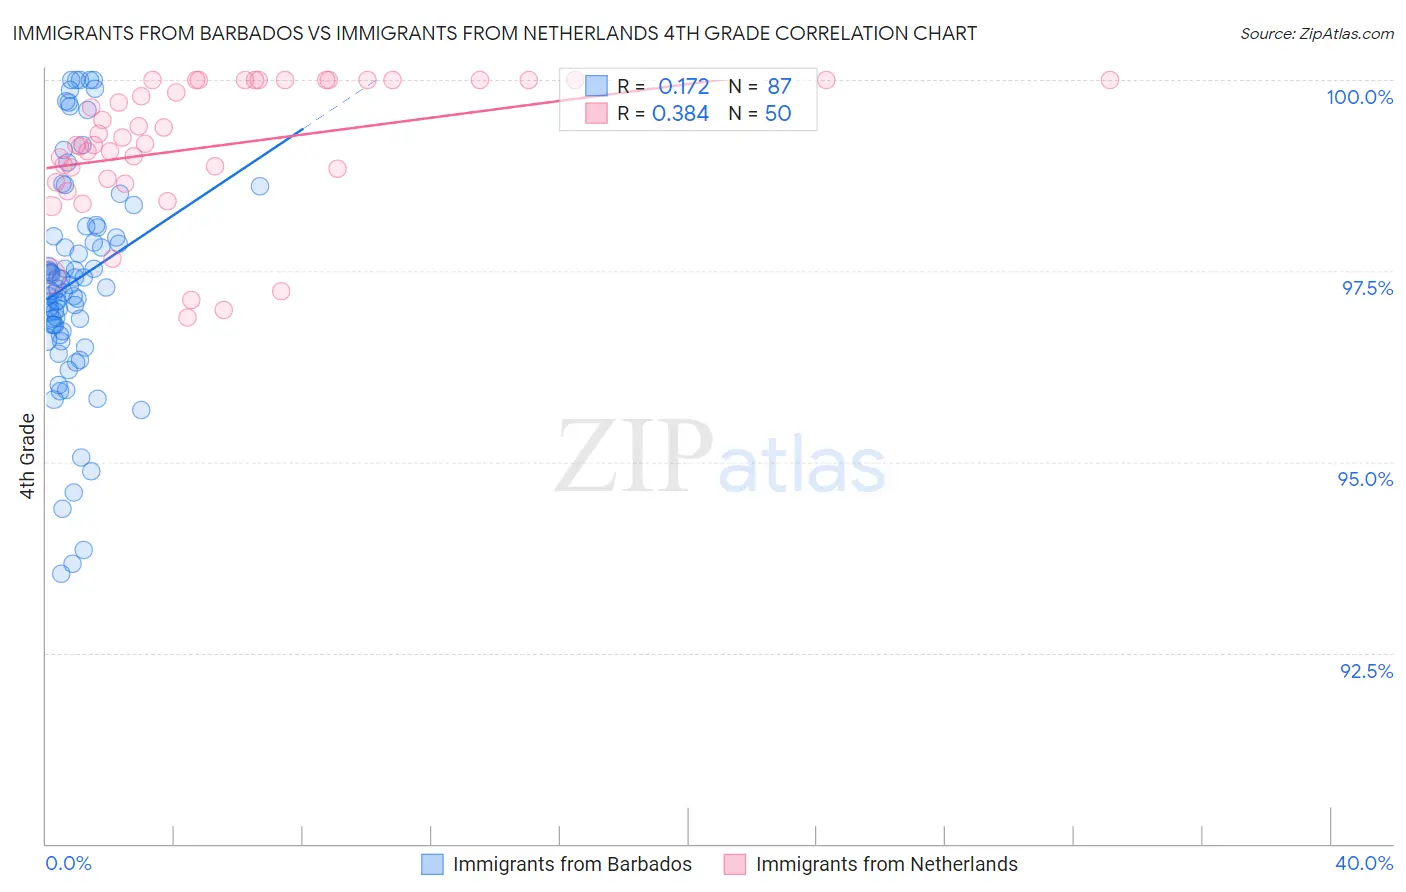
Immigrants from Barbados vs Immigrants from Netherlands 4th Grade Correlation Chart

The statistical analysis conducted on geographies consisting of 112,788,359 people shows a poor positive correlation between the proportion of Immigrants from Barbados and percentage of population with at least 4th grade education in the United States with a correlation coefficient (R) of 0.172 and weighted average of 96.8%. Similarly, the statistical analysis conducted on geographies consisting of 237,869,934 people shows a mild positive correlation between the proportion of Immigrants from Netherlands and percentage of population with at least 4th grade education in the United States with a correlation coefficient (R) of 0.384 and weighted average of 98.0%, a difference of 1.2%.
Immigrants from Barbados vs Immigrants from Netherlands 4th Grade

4th Grade Correlation Summary

MeasurementImmigrants from BarbadosImmigrants from Netherlands
Minimum93.5%96.9%
Maximum100.0%100.0%
Range6.5%3.1%
Mean97.4%99.1%
Median97.3%99.2%
Interquartile 25% (IQ1)96.7%98.7%
Interquartile 75% (IQ3)98.1%100.0%
Interquartile Range (IQR)1.4%1.3%
Standard Deviation (Sample)1.4%0.90%
Standard Deviation (Population)1.4%0.89%

Similar Demographics by 4th Grade

Demographics Similar to Immigrants from Barbados by 4th Grade

In terms of 4th grade, the demographic groups most similar to Immigrants from Barbados are Immigrants from Thailand (96.8%, a difference of 0.0%), Immigrants from St. Vincent and the Grenadines (96.8%, a difference of 0.020%), Immigrants from Philippines (96.8%, a difference of 0.040%), Houma (96.8%, a difference of 0.040%), and Immigrants from Afghanistan (96.8%, a difference of 0.040%).
DemographicsRating | Rank4th Grade
Immigrants | Bolivia
0.1
/100
|
#278
Tragic
96.9%
Afghans
0.1
/100
|
#279
Tragic
96.9%
Barbadians
0.1
/100
|
#280
Tragic
96.9%
Immigrants | Hong Kong
0.1
/100
|
#281
Tragic
96.9%
Immigrants | Trinidad and Tobago
0.1
/100
|
#282
Tragic
96.8%
Immigrants | Philippines
0.1
/100
|
#283
Tragic
96.8%
Immigrants | St. Vincent and the Grenadines
0.1
/100
|
#284
Tragic
96.8%
Immigrants | Barbados
0.0
/100
|
#285
Tragic
96.8%
Immigrants | Thailand
0.0
/100
|
#286
Tragic
96.8%
Houma
0.0
/100
|
#287
Tragic
96.8%
Immigrants | Afghanistan
0.0
/100
|
#288
Tragic
96.8%
Immigrants | West Indies
0.0
/100
|
#289
Tragic
96.7%
British West Indians
0.0
/100
|
#290
Tragic
96.7%
Immigrants | Grenada
0.0
/100
|
#291
Tragic
96.7%
Malaysians
0.0
/100
|
#292
Tragic
96.7%

Demographics Similar to Immigrants from Netherlands by 4th Grade

In terms of 4th grade, the demographic groups most similar to Immigrants from Netherlands are Cherokee (98.0%, a difference of 0.0%), Immigrants from Lithuania (98.0%, a difference of 0.0%), Chickasaw (98.0%, a difference of 0.010%), Immigrants from England (98.0%, a difference of 0.010%), and Ukrainian (98.0%, a difference of 0.010%).
DemographicsRating | Rank4th Grade
Kiowa
99.6
/100
|
#68
Exceptional
98.0%
Pueblo
99.6
/100
|
#69
Exceptional
98.0%
Immigrants | Austria
99.6
/100
|
#70
Exceptional
98.0%
Lumbee
99.6
/100
|
#71
Exceptional
98.0%
Iranians
99.4
/100
|
#72
Exceptional
98.0%
Macedonians
99.4
/100
|
#73
Exceptional
98.0%
Chickasaw
99.4
/100
|
#74
Exceptional
98.0%
Immigrants | Netherlands
99.3
/100
|
#75
Exceptional
98.0%
Cherokee
99.3
/100
|
#76
Exceptional
98.0%
Immigrants | Lithuania
99.3
/100
|
#77
Exceptional
98.0%
Immigrants | England
99.3
/100
|
#78
Exceptional
98.0%
Ukrainians
99.2
/100
|
#79
Exceptional
98.0%
Osage
99.2
/100
|
#80
Exceptional
98.0%
Immigrants | India
99.1
/100
|
#81
Exceptional
98.0%
Icelanders
99.1
/100
|
#82
Exceptional
98.0%