Immigrants from Barbados vs Immigrants 11th Grade
COMPARE
Immigrants from Barbados
Immigrants
11th Grade
11th Grade Comparison
Immigrants from Barbados
Immigrants
90.7%
11TH GRADE
0.0/ 100
METRIC RATING
283rd/ 347
METRIC RANK
89.7%
11TH GRADE
0.0/ 100
METRIC RATING
303rd/ 347
METRIC RANK
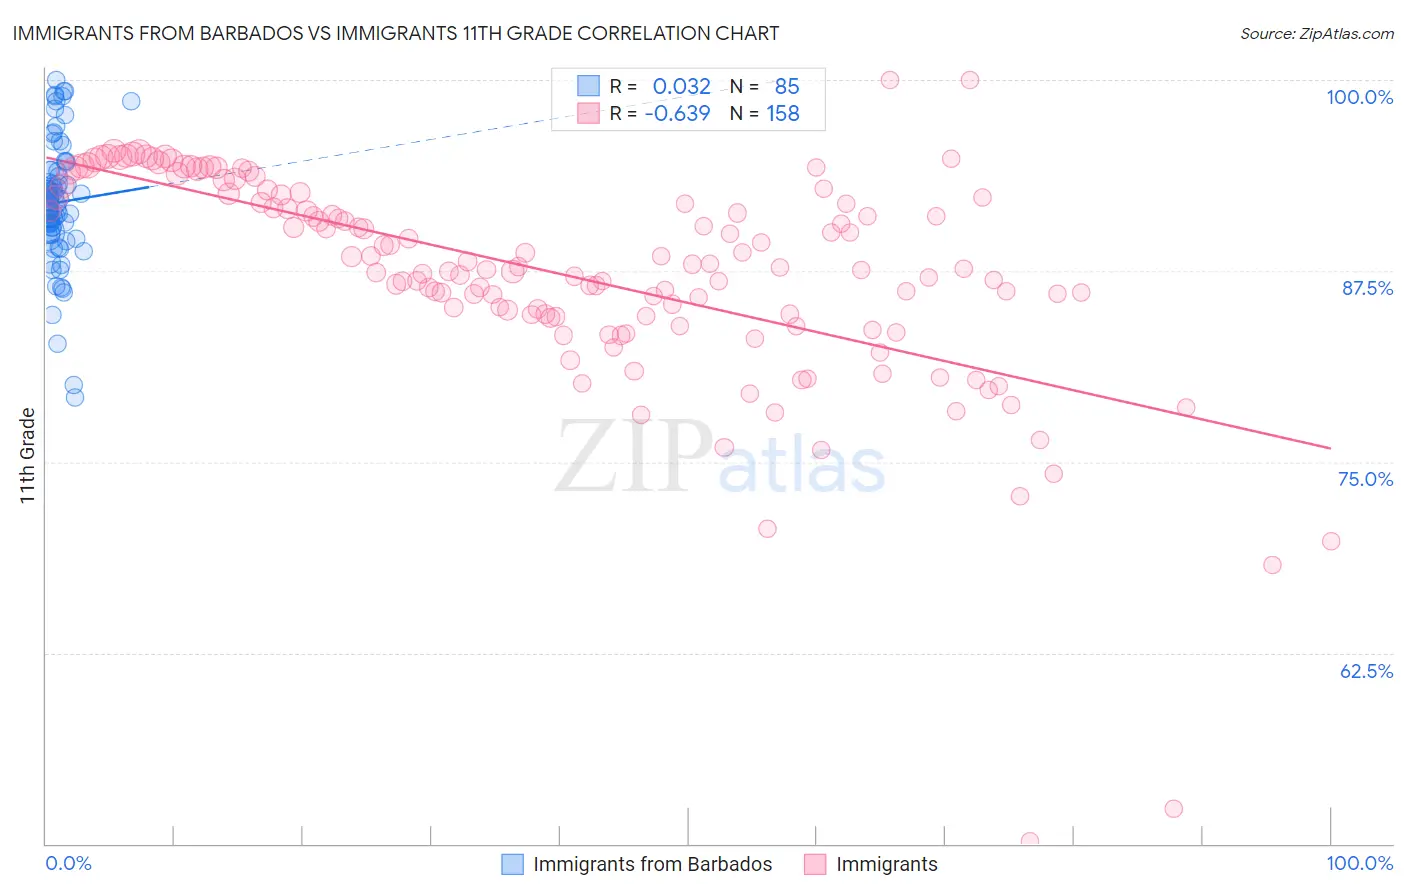
Immigrants from Barbados vs Immigrants 11th Grade Correlation Chart
The statistical analysis conducted on geographies consisting of 112,782,130 people shows no correlation between the proportion of Immigrants from Barbados and percentage of population with at least 11th grade education in the United States with a correlation coefficient (R) of 0.032 and weighted average of 90.7%. Similarly, the statistical analysis conducted on geographies consisting of 577,785,939 people shows a significant negative correlation between the proportion of Immigrants and percentage of population with at least 11th grade education in the United States with a correlation coefficient (R) of -0.639 and weighted average of 89.7%, a difference of 1.1%.
11th Grade Correlation Summary
| Measurement | Immigrants from Barbados | Immigrants |
| Minimum | 79.2% | 50.2% |
| Maximum | 100.0% | 100.0% |
| Range | 20.8% | 49.8% |
| Mean | 92.0% | 87.3% |
| Median | 92.0% | 87.7% |
| Interquartile 25% (IQ1) | 90.0% | 84.6% |
| Interquartile 75% (IQ3) | 94.1% | 92.3% |
| Interquartile Range (IQR) | 4.1% | 7.8% |
| Standard Deviation (Sample) | 4.0% | 7.1% |
| Standard Deviation (Population) | 4.0% | 7.1% |
Demographics Similar to Immigrants from Barbados and Immigrants by 11th Grade
In terms of 11th grade, the demographic groups most similar to Immigrants from Barbados are Immigrants from Laos (90.5%, a difference of 0.17%), Immigrants from Burma/Myanmar (90.4%, a difference of 0.26%), Immigrants from West Indies (90.4%, a difference of 0.31%), Apache (90.4%, a difference of 0.32%), and Pennsylvania German (90.3%, a difference of 0.34%). Similarly, the demographic groups most similar to Immigrants are Immigrants from Guyana (89.7%, a difference of 0.010%), Guyanese (89.9%, a difference of 0.20%), Immigrants from Haiti (89.9%, a difference of 0.21%), Japanese (89.9%, a difference of 0.22%), and Immigrants from Fiji (89.9%, a difference of 0.25%).
| Demographics | Rating | Rank | 11th Grade |
| Immigrants | Barbados | 0.0 /100 | #283 | Tragic 90.7% |
| Immigrants | Laos | 0.0 /100 | #284 | Tragic 90.5% |
| Immigrants | Burma/Myanmar | 0.0 /100 | #285 | Tragic 90.4% |
| Immigrants | West Indies | 0.0 /100 | #286 | Tragic 90.4% |
| Apache | 0.0 /100 | #287 | Tragic 90.4% |
| Pennsylvania Germans | 0.0 /100 | #288 | Tragic 90.3% |
| British West Indians | 0.0 /100 | #289 | Tragic 90.3% |
| Indonesians | 0.0 /100 | #290 | Tragic 90.3% |
| Haitians | 0.0 /100 | #291 | Tragic 90.3% |
| Cubans | 0.0 /100 | #292 | Tragic 90.2% |
| Natives/Alaskans | 0.0 /100 | #293 | Tragic 90.2% |
| Immigrants | Grenada | 0.0 /100 | #294 | Tragic 90.1% |
| Immigrants | Vietnam | 0.0 /100 | #295 | Tragic 90.0% |
| Fijians | 0.0 /100 | #296 | Tragic 90.0% |
| Navajo | 0.0 /100 | #297 | Tragic 90.0% |
| Immigrants | Fiji | 0.0 /100 | #298 | Tragic 89.9% |
| Japanese | 0.0 /100 | #299 | Tragic 89.9% |
| Immigrants | Haiti | 0.0 /100 | #300 | Tragic 89.9% |
| Guyanese | 0.0 /100 | #301 | Tragic 89.9% |
| Immigrants | Guyana | 0.0 /100 | #302 | Tragic 89.7% |
| Immigrants | Immigrants | 0.0 /100 | #303 | Tragic 89.7% |