Immigrants from Bangladesh vs Immigrants from Italy 11th Grade
COMPARE
Immigrants from Bangladesh
Immigrants from Italy
11th Grade
11th Grade Comparison
Immigrants from Bangladesh
Immigrants from Italy
89.5%
11TH GRADE
0.0/ 100
METRIC RATING
309th/ 347
METRIC RANK
92.9%
11TH GRADE
86.6/ 100
METRIC RATING
135th/ 347
METRIC RANK
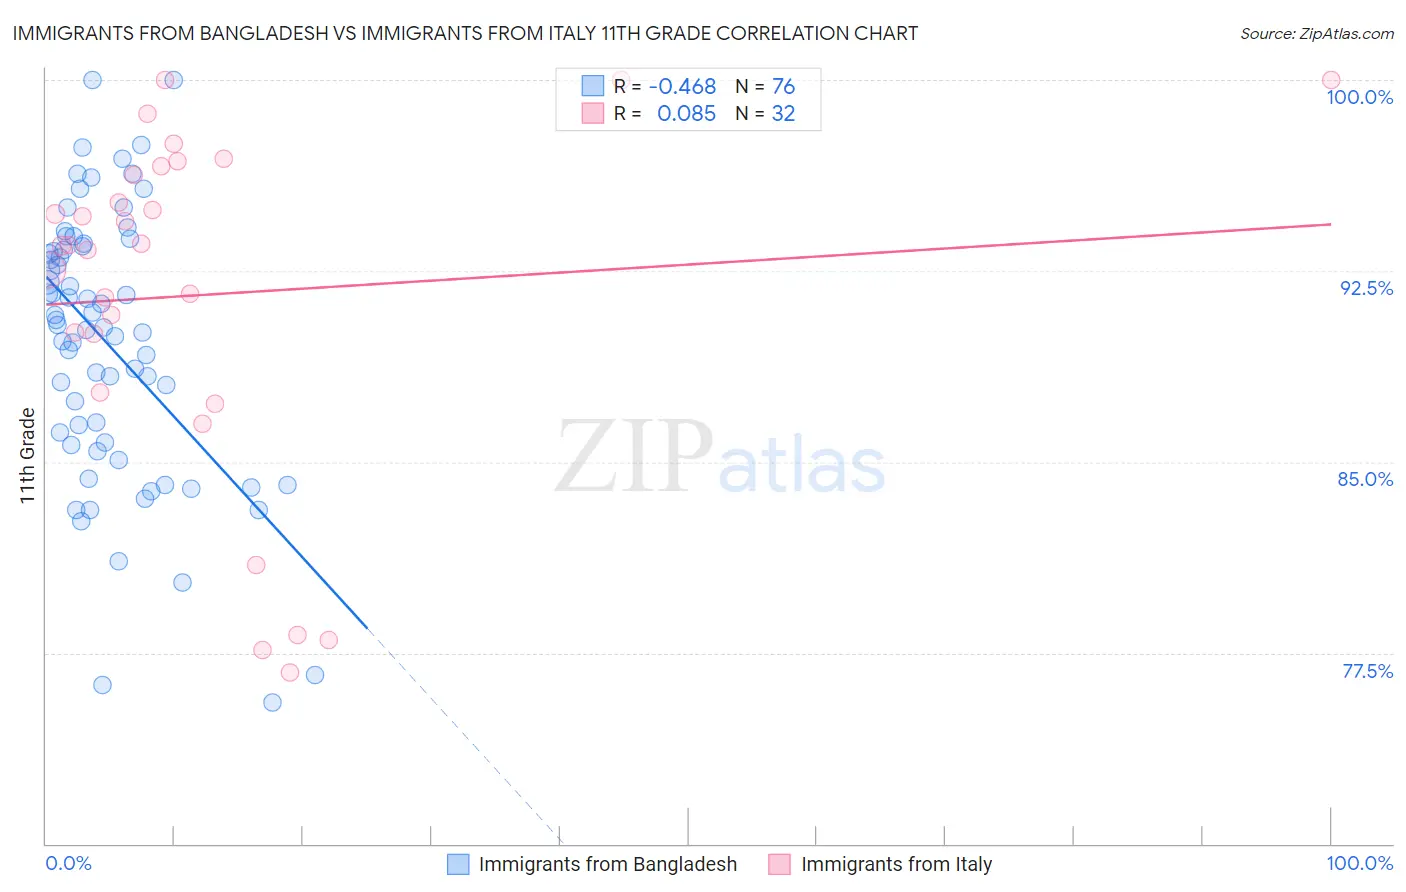
Immigrants from Bangladesh vs Immigrants from Italy 11th Grade Correlation Chart
The statistical analysis conducted on geographies consisting of 203,672,706 people shows a moderate negative correlation between the proportion of Immigrants from Bangladesh and percentage of population with at least 11th grade education in the United States with a correlation coefficient (R) of -0.468 and weighted average of 89.5%. Similarly, the statistical analysis conducted on geographies consisting of 324,226,009 people shows a slight positive correlation between the proportion of Immigrants from Italy and percentage of population with at least 11th grade education in the United States with a correlation coefficient (R) of 0.085 and weighted average of 92.9%, a difference of 3.8%.
11th Grade Correlation Summary
| Measurement | Immigrants from Bangladesh | Immigrants from Italy |
| Minimum | 75.6% | 76.7% |
| Maximum | 100.0% | 100.0% |
| Range | 24.4% | 23.3% |
| Mean | 89.6% | 91.6% |
| Median | 90.3% | 93.5% |
| Interquartile 25% (IQ1) | 85.7% | 88.9% |
| Interquartile 75% (IQ3) | 93.4% | 96.5% |
| Interquartile Range (IQR) | 7.7% | 7.6% |
| Standard Deviation (Sample) | 5.3% | 6.8% |
| Standard Deviation (Population) | 5.3% | 6.7% |
Similar Demographics by 11th Grade
Demographics Similar to Immigrants from Bangladesh by 11th Grade
In terms of 11th grade, the demographic groups most similar to Immigrants from Bangladesh are Yaqui (89.5%, a difference of 0.010%), Nepalese (89.5%, a difference of 0.020%), Immigrants from Dominica (89.5%, a difference of 0.040%), Vietnamese (89.4%, a difference of 0.080%), and Ecuadorian (89.6%, a difference of 0.10%).
| Demographics | Rating | Rank | 11th Grade |
| Immigrants | Guyana | 0.0 /100 | #302 | Tragic 89.7% |
| Immigrants | Immigrants | 0.0 /100 | #303 | Tragic 89.7% |
| Yuman | 0.0 /100 | #304 | Tragic 89.7% |
| Immigrants | Cambodia | 0.0 /100 | #305 | Tragic 89.6% |
| Ecuadorians | 0.0 /100 | #306 | Tragic 89.6% |
| Immigrants | Dominica | 0.0 /100 | #307 | Tragic 89.5% |
| Nepalese | 0.0 /100 | #308 | Tragic 89.5% |
| Immigrants | Bangladesh | 0.0 /100 | #309 | Tragic 89.5% |
| Yaqui | 0.0 /100 | #310 | Tragic 89.5% |
| Vietnamese | 0.0 /100 | #311 | Tragic 89.4% |
| Immigrants | Portugal | 0.0 /100 | #312 | Tragic 89.3% |
| Immigrants | Caribbean | 0.0 /100 | #313 | Tragic 89.1% |
| Cape Verdeans | 0.0 /100 | #314 | Tragic 89.1% |
| Immigrants | Ecuador | 0.0 /100 | #315 | Tragic 89.1% |
| Immigrants | Cuba | 0.0 /100 | #316 | Tragic 88.9% |
Demographics Similar to Immigrants from Italy by 11th Grade
In terms of 11th grade, the demographic groups most similar to Immigrants from Italy are Cree (92.9%, a difference of 0.010%), Mongolian (93.0%, a difference of 0.020%), Delaware (93.0%, a difference of 0.020%), Arab (92.9%, a difference of 0.020%), and Immigrants from Brazil (92.9%, a difference of 0.030%).
| Demographics | Rating | Rank | 11th Grade |
| Immigrants | Jordan | 92.4 /100 | #128 | Exceptional 93.1% |
| Immigrants | Ukraine | 89.8 /100 | #129 | Excellent 93.0% |
| Albanians | 89.5 /100 | #130 | Excellent 93.0% |
| Egyptians | 89.5 /100 | #131 | Excellent 93.0% |
| Immigrants | Bosnia and Herzegovina | 89.0 /100 | #132 | Excellent 93.0% |
| Mongolians | 87.6 /100 | #133 | Excellent 93.0% |
| Delaware | 87.3 /100 | #134 | Excellent 93.0% |
| Immigrants | Italy | 86.6 /100 | #135 | Excellent 92.9% |
| Cree | 85.9 /100 | #136 | Excellent 92.9% |
| Arabs | 85.4 /100 | #137 | Excellent 92.9% |
| Immigrants | Brazil | 85.1 /100 | #138 | Excellent 92.9% |
| Crow | 84.1 /100 | #139 | Excellent 92.9% |
| Venezuelans | 83.4 /100 | #140 | Excellent 92.9% |
| Chileans | 83.0 /100 | #141 | Excellent 92.9% |
| Kenyans | 82.0 /100 | #142 | Excellent 92.9% |