Immigrants from Bangladesh vs Immigrants from Iraq 7th Grade
COMPARE
Immigrants from Bangladesh
Immigrants from Iraq
7th Grade
7th Grade Comparison
Immigrants from Bangladesh
Immigrants from Iraq
94.0%
7TH GRADE
0.0/ 100
METRIC RATING
313th/ 347
METRIC RANK
96.0%
7TH GRADE
36.1/ 100
METRIC RATING
186th/ 347
METRIC RANK
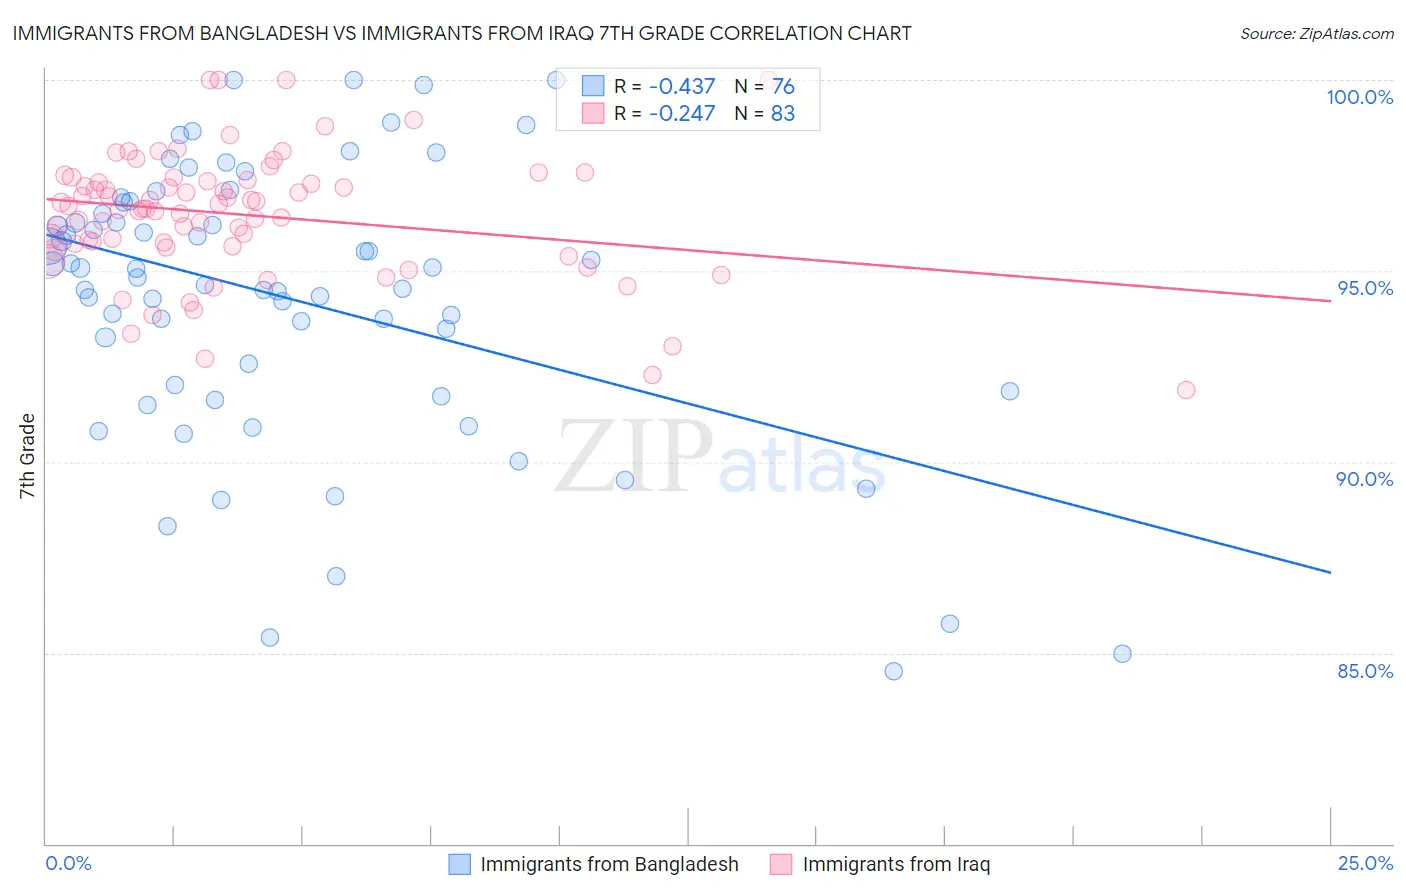
Immigrants from Bangladesh vs Immigrants from Iraq 7th Grade Correlation Chart
The statistical analysis conducted on geographies consisting of 203,672,706 people shows a moderate negative correlation between the proportion of Immigrants from Bangladesh and percentage of population with at least 7th grade education in the United States with a correlation coefficient (R) of -0.437 and weighted average of 94.0%. Similarly, the statistical analysis conducted on geographies consisting of 194,632,332 people shows a weak negative correlation between the proportion of Immigrants from Iraq and percentage of population with at least 7th grade education in the United States with a correlation coefficient (R) of -0.247 and weighted average of 96.0%, a difference of 2.1%.
7th Grade Correlation Summary
| Measurement | Immigrants from Bangladesh | Immigrants from Iraq |
| Minimum | 84.5% | 91.9% |
| Maximum | 100.0% | 100.0% |
| Range | 15.5% | 8.1% |
| Mean | 94.3% | 96.5% |
| Median | 94.9% | 96.6% |
| Interquartile 25% (IQ1) | 91.9% | 95.7% |
| Interquartile 75% (IQ3) | 96.6% | 97.4% |
| Interquartile Range (IQR) | 4.7% | 1.7% |
| Standard Deviation (Sample) | 3.6% | 1.7% |
| Standard Deviation (Population) | 3.6% | 1.6% |
Similar Demographics by 7th Grade
Demographics Similar to Immigrants from Bangladesh by 7th Grade
In terms of 7th grade, the demographic groups most similar to Immigrants from Bangladesh are Immigrants (94.0%, a difference of 0.0%), Japanese (94.0%, a difference of 0.030%), Puerto Rican (94.0%, a difference of 0.040%), Immigrants from Caribbean (94.0%, a difference of 0.050%), and Ecuadorian (94.0%, a difference of 0.070%).
| Demographics | Rating | Rank | 7th Grade |
| Immigrants | Guyana | 0.0 /100 | #306 | Tragic 94.2% |
| Immigrants | Portugal | 0.0 /100 | #307 | Tragic 94.2% |
| Cape Verdeans | 0.0 /100 | #308 | Tragic 94.1% |
| Ecuadorians | 0.0 /100 | #309 | Tragic 94.0% |
| Immigrants | Caribbean | 0.0 /100 | #310 | Tragic 94.0% |
| Puerto Ricans | 0.0 /100 | #311 | Tragic 94.0% |
| Immigrants | Immigrants | 0.0 /100 | #312 | Tragic 94.0% |
| Immigrants | Bangladesh | 0.0 /100 | #313 | Tragic 94.0% |
| Japanese | 0.0 /100 | #314 | Tragic 94.0% |
| Vietnamese | 0.0 /100 | #315 | Tragic 93.9% |
| Immigrants | Vietnam | 0.0 /100 | #316 | Tragic 93.9% |
| Immigrants | Cuba | 0.0 /100 | #317 | Tragic 93.8% |
| Immigrants | Ecuador | 0.0 /100 | #318 | Tragic 93.7% |
| Immigrants | Cambodia | 0.0 /100 | #319 | Tragic 93.7% |
| Immigrants | Fiji | 0.0 /100 | #320 | Tragic 93.5% |
Demographics Similar to Immigrants from Iraq by 7th Grade
In terms of 7th grade, the demographic groups most similar to Immigrants from Iraq are Immigrants from Uganda (96.0%, a difference of 0.0%), Sierra Leonean (96.0%, a difference of 0.010%), Brazilian (96.0%, a difference of 0.010%), Immigrants from Egypt (95.9%, a difference of 0.010%), and Immigrants from Venezuela (95.9%, a difference of 0.010%).
| Demographics | Rating | Rank | 7th Grade |
| Immigrants | Iran | 47.8 /100 | #179 | Average 96.0% |
| Immigrants | Brazil | 46.8 /100 | #180 | Average 96.0% |
| Pakistanis | 44.5 /100 | #181 | Average 96.0% |
| Iraqis | 41.2 /100 | #182 | Average 96.0% |
| Immigrants | Spain | 38.8 /100 | #183 | Fair 96.0% |
| Sierra Leoneans | 37.5 /100 | #184 | Fair 96.0% |
| Brazilians | 37.3 /100 | #185 | Fair 96.0% |
| Immigrants | Iraq | 36.1 /100 | #186 | Fair 96.0% |
| Immigrants | Uganda | 36.0 /100 | #187 | Fair 96.0% |
| Immigrants | Egypt | 34.3 /100 | #188 | Fair 95.9% |
| Immigrants | Venezuela | 33.9 /100 | #189 | Fair 95.9% |
| Immigrants | Micronesia | 32.6 /100 | #190 | Fair 95.9% |
| Liberians | 32.5 /100 | #191 | Fair 95.9% |
| Panamanians | 32.3 /100 | #192 | Fair 95.9% |
| Immigrants | Bahamas | 30.8 /100 | #193 | Fair 95.9% |