Immigrants from Bangladesh vs Immigrants from Croatia High School Diploma
COMPARE
Immigrants from Bangladesh
Immigrants from Croatia
High School Diploma
High School Diploma Comparison
Immigrants from Bangladesh
Immigrants from Croatia
85.5%
HIGH SCHOOL DIPLOMA
0.0/ 100
METRIC RATING
300th/ 347
METRIC RANK
90.4%
HIGH SCHOOL DIPLOMA
97.8/ 100
METRIC RATING
104th/ 347
METRIC RANK
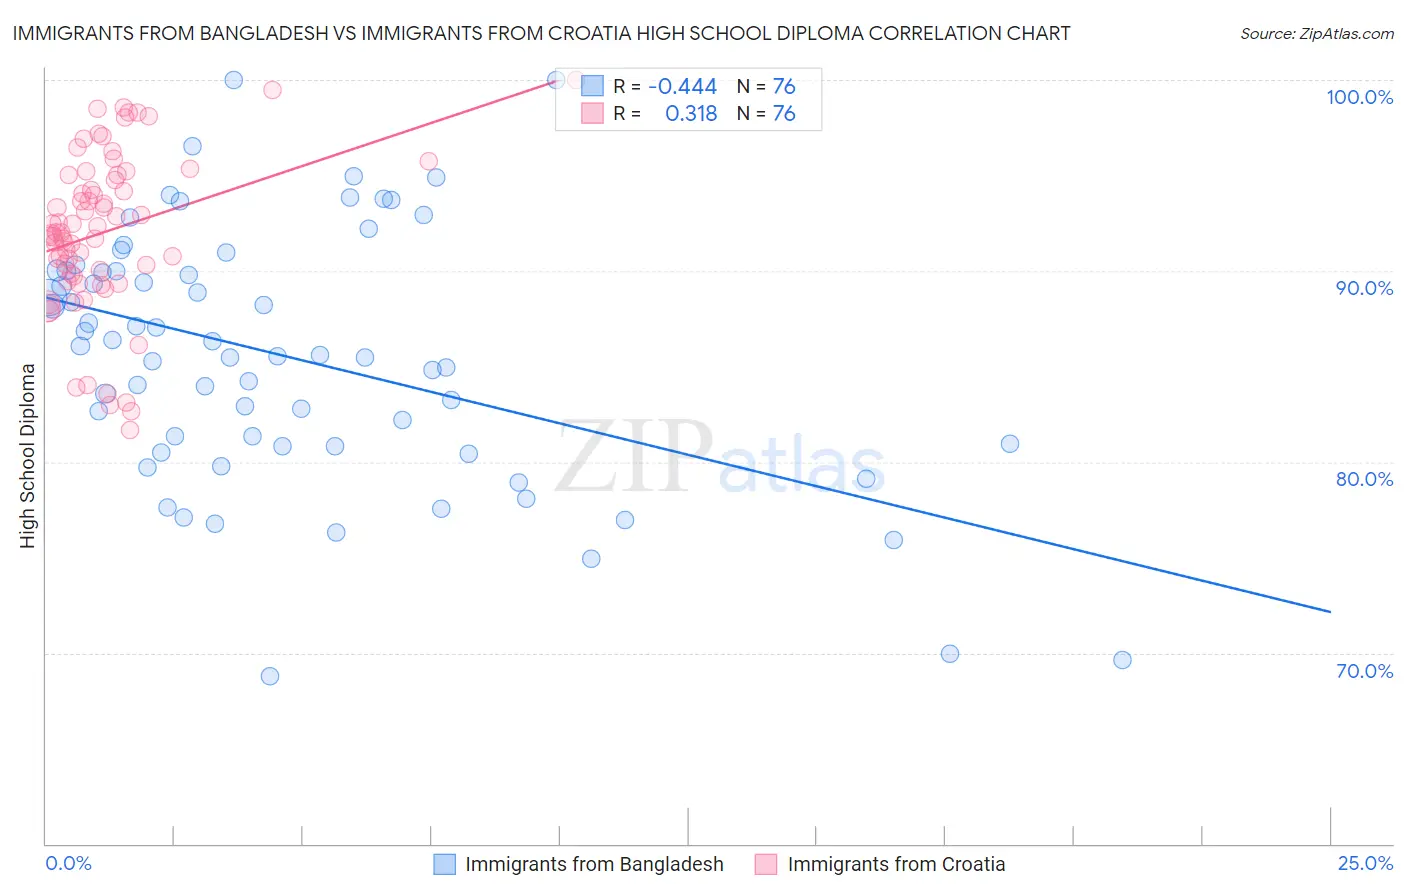
Immigrants from Bangladesh vs Immigrants from Croatia High School Diploma Correlation Chart
The statistical analysis conducted on geographies consisting of 203,672,706 people shows a moderate negative correlation between the proportion of Immigrants from Bangladesh and percentage of population with at least high school diploma education in the United States with a correlation coefficient (R) of -0.444 and weighted average of 85.5%. Similarly, the statistical analysis conducted on geographies consisting of 132,548,119 people shows a mild positive correlation between the proportion of Immigrants from Croatia and percentage of population with at least high school diploma education in the United States with a correlation coefficient (R) of 0.318 and weighted average of 90.4%, a difference of 5.8%.
High School Diploma Correlation Summary
| Measurement | Immigrants from Bangladesh | Immigrants from Croatia |
| Minimum | 68.8% | 81.7% |
| Maximum | 100.0% | 100.0% |
| Range | 31.2% | 18.3% |
| Mean | 85.4% | 92.1% |
| Median | 85.6% | 92.0% |
| Interquartile 25% (IQ1) | 80.8% | 89.8% |
| Interquartile 75% (IQ3) | 90.0% | 95.0% |
| Interquartile Range (IQR) | 9.1% | 5.2% |
| Standard Deviation (Sample) | 6.7% | 4.2% |
| Standard Deviation (Population) | 6.6% | 4.2% |
Similar Demographics by High School Diploma
Demographics Similar to Immigrants from Bangladesh by High School Diploma
In terms of high school diploma, the demographic groups most similar to Immigrants from Bangladesh are Guyanese (85.5%, a difference of 0.020%), Vietnamese (85.4%, a difference of 0.020%), Immigrants from Haiti (85.4%, a difference of 0.060%), Cuban (85.4%, a difference of 0.060%), and Native/Alaskan (85.6%, a difference of 0.12%).
| Demographics | Rating | Rank | High School Diploma |
| British West Indians | 0.0 /100 | #293 | Tragic 85.9% |
| Immigrants | Fiji | 0.0 /100 | #294 | Tragic 85.8% |
| Immigrants | Immigrants | 0.0 /100 | #295 | Tragic 85.8% |
| Immigrants | Cambodia | 0.0 /100 | #296 | Tragic 85.6% |
| Immigrants | Grenada | 0.0 /100 | #297 | Tragic 85.6% |
| Natives/Alaskans | 0.0 /100 | #298 | Tragic 85.6% |
| Guyanese | 0.0 /100 | #299 | Tragic 85.5% |
| Immigrants | Bangladesh | 0.0 /100 | #300 | Tragic 85.5% |
| Vietnamese | 0.0 /100 | #301 | Tragic 85.4% |
| Immigrants | Haiti | 0.0 /100 | #302 | Tragic 85.4% |
| Cubans | 0.0 /100 | #303 | Tragic 85.4% |
| Nepalese | 0.0 /100 | #304 | Tragic 85.3% |
| Immigrants | Portugal | 0.0 /100 | #305 | Tragic 85.3% |
| Immigrants | Guyana | 0.0 /100 | #306 | Tragic 85.3% |
| Navajo | 0.0 /100 | #307 | Tragic 85.2% |
Demographics Similar to Immigrants from Croatia by High School Diploma
In terms of high school diploma, the demographic groups most similar to Immigrants from Croatia are Immigrants from Romania (90.4%, a difference of 0.010%), Aleut (90.4%, a difference of 0.030%), Immigrants from Norway (90.5%, a difference of 0.040%), Immigrants from North Macedonia (90.5%, a difference of 0.060%), and Lebanese (90.4%, a difference of 0.060%).
| Demographics | Rating | Rank | High School Diploma |
| Immigrants | Kuwait | 98.3 /100 | #97 | Exceptional 90.5% |
| Immigrants | Korea | 98.3 /100 | #98 | Exceptional 90.5% |
| Immigrants | Europe | 98.2 /100 | #99 | Exceptional 90.5% |
| Immigrants | North Macedonia | 98.1 /100 | #100 | Exceptional 90.5% |
| Immigrants | Norway | 98.0 /100 | #101 | Exceptional 90.5% |
| Aleuts | 98.0 /100 | #102 | Exceptional 90.4% |
| Immigrants | Romania | 97.8 /100 | #103 | Exceptional 90.4% |
| Immigrants | Croatia | 97.8 /100 | #104 | Exceptional 90.4% |
| Lebanese | 97.4 /100 | #105 | Exceptional 90.4% |
| Syrians | 97.0 /100 | #106 | Exceptional 90.3% |
| Immigrants | Russia | 96.9 /100 | #107 | Exceptional 90.3% |
| Palestinians | 96.7 /100 | #108 | Exceptional 90.3% |
| Immigrants | Zimbabwe | 96.7 /100 | #109 | Exceptional 90.3% |
| Immigrants | Greece | 96.6 /100 | #110 | Exceptional 90.3% |
| Menominee | 96.6 /100 | #111 | Exceptional 90.3% |