Immigrants from Bangladesh vs Immigrants from Australia 10th Grade
COMPARE
Immigrants from Bangladesh
Immigrants from Australia
10th Grade
10th Grade Comparison
Immigrants from Bangladesh
Immigrants from Australia
91.0%
10TH GRADE
0.0/ 100
METRIC RATING
308th/ 347
METRIC RANK
94.9%
10TH GRADE
99.7/ 100
METRIC RATING
66th/ 347
METRIC RANK
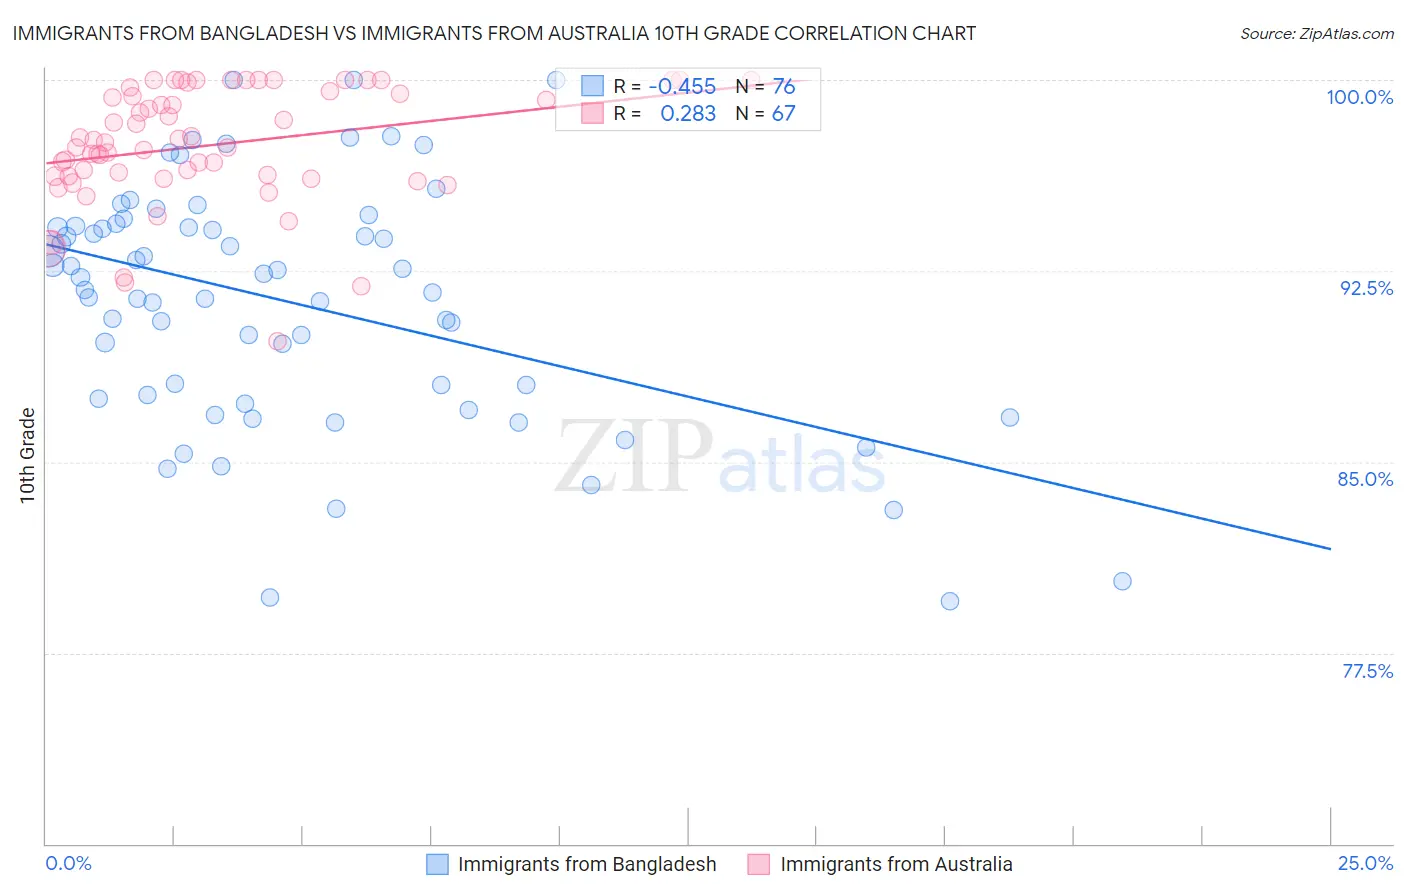
Immigrants from Bangladesh vs Immigrants from Australia 10th Grade Correlation Chart
The statistical analysis conducted on geographies consisting of 203,672,706 people shows a moderate negative correlation between the proportion of Immigrants from Bangladesh and percentage of population with at least 10th grade education in the United States with a correlation coefficient (R) of -0.455 and weighted average of 91.0%. Similarly, the statistical analysis conducted on geographies consisting of 227,202,695 people shows a weak positive correlation between the proportion of Immigrants from Australia and percentage of population with at least 10th grade education in the United States with a correlation coefficient (R) of 0.283 and weighted average of 94.9%, a difference of 4.3%.
10th Grade Correlation Summary
| Measurement | Immigrants from Bangladesh | Immigrants from Australia |
| Minimum | 79.5% | 89.8% |
| Maximum | 100.0% | 100.0% |
| Range | 20.5% | 10.2% |
| Mean | 91.2% | 97.4% |
| Median | 92.0% | 97.5% |
| Interquartile 25% (IQ1) | 87.6% | 96.2% |
| Interquartile 75% (IQ3) | 94.2% | 99.6% |
| Interquartile Range (IQR) | 6.7% | 3.4% |
| Standard Deviation (Sample) | 4.7% | 2.3% |
| Standard Deviation (Population) | 4.7% | 2.3% |
Similar Demographics by 10th Grade
Demographics Similar to Immigrants from Bangladesh by 10th Grade
In terms of 10th grade, the demographic groups most similar to Immigrants from Bangladesh are Immigrants from Fiji (91.0%, a difference of 0.010%), Immigrants (91.0%, a difference of 0.040%), Yaqui (91.1%, a difference of 0.070%), Vietnamese (90.9%, a difference of 0.080%), and Immigrants from Cambodia (90.9%, a difference of 0.10%).
| Demographics | Rating | Rank | 10th Grade |
| Japanese | 0.0 /100 | #301 | Tragic 91.2% |
| Immigrants | Guyana | 0.0 /100 | #302 | Tragic 91.2% |
| Immigrants | Vietnam | 0.0 /100 | #303 | Tragic 91.2% |
| Pima | 0.0 /100 | #304 | Tragic 91.2% |
| Immigrants | Dominica | 0.0 /100 | #305 | Tragic 91.1% |
| Yaqui | 0.0 /100 | #306 | Tragic 91.1% |
| Immigrants | Fiji | 0.0 /100 | #307 | Tragic 91.0% |
| Immigrants | Bangladesh | 0.0 /100 | #308 | Tragic 91.0% |
| Immigrants | Immigrants | 0.0 /100 | #309 | Tragic 91.0% |
| Vietnamese | 0.0 /100 | #310 | Tragic 90.9% |
| Immigrants | Cambodia | 0.0 /100 | #311 | Tragic 90.9% |
| Immigrants | Portugal | 0.0 /100 | #312 | Tragic 90.8% |
| Cape Verdeans | 0.0 /100 | #313 | Tragic 90.8% |
| Nepalese | 0.0 /100 | #314 | Tragic 90.7% |
| Immigrants | Caribbean | 0.0 /100 | #315 | Tragic 90.6% |
Demographics Similar to Immigrants from Australia by 10th Grade
In terms of 10th grade, the demographic groups most similar to Immigrants from Australia are Immigrants from Netherlands (94.9%, a difference of 0.0%), Immigrants from Belgium (94.9%, a difference of 0.0%), Immigrants from England (94.9%, a difference of 0.020%), Zimbabwean (94.9%, a difference of 0.030%), and Alaska Native (94.9%, a difference of 0.030%).
| Demographics | Rating | Rank | 10th Grade |
| Celtics | 99.8 /100 | #59 | Exceptional 95.0% |
| Cypriots | 99.8 /100 | #60 | Exceptional 95.0% |
| Chippewa | 99.8 /100 | #61 | Exceptional 95.0% |
| Thais | 99.8 /100 | #62 | Exceptional 95.0% |
| Immigrants | Singapore | 99.8 /100 | #63 | Exceptional 95.0% |
| Native Hawaiians | 99.7 /100 | #64 | Exceptional 95.0% |
| Turks | 99.7 /100 | #65 | Exceptional 95.0% |
| Immigrants | Australia | 99.7 /100 | #66 | Exceptional 94.9% |
| Immigrants | Netherlands | 99.7 /100 | #67 | Exceptional 94.9% |
| Immigrants | Belgium | 99.7 /100 | #68 | Exceptional 94.9% |
| Immigrants | England | 99.6 /100 | #69 | Exceptional 94.9% |
| Zimbabweans | 99.6 /100 | #70 | Exceptional 94.9% |
| Alaska Natives | 99.6 /100 | #71 | Exceptional 94.9% |
| Immigrants | Sweden | 99.6 /100 | #72 | Exceptional 94.9% |
| Bhutanese | 99.6 /100 | #73 | Exceptional 94.9% |