Immigrants from Bangladesh vs French Canadian 9th Grade
COMPARE
Immigrants from Bangladesh
French Canadian
9th Grade
9th Grade Comparison
Immigrants from Bangladesh
French Canadians
92.4%
9TH GRADE
0.0/ 100
METRIC RATING
309th/ 347
METRIC RANK
96.3%
9TH GRADE
100.0/ 100
METRIC RATING
26th/ 347
METRIC RANK
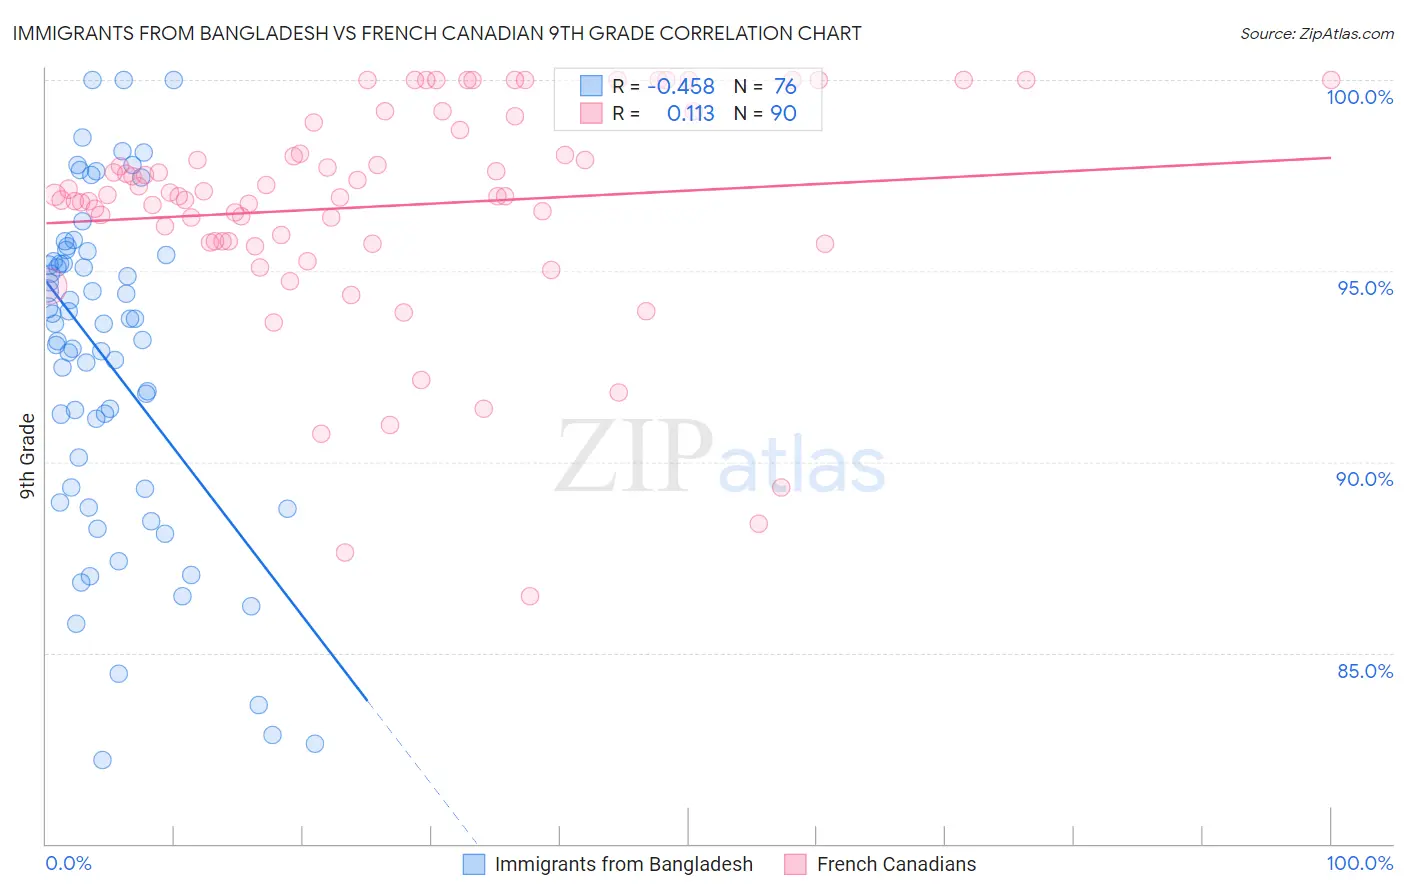
Immigrants from Bangladesh vs French Canadian 9th Grade Correlation Chart
The statistical analysis conducted on geographies consisting of 203,672,706 people shows a moderate negative correlation between the proportion of Immigrants from Bangladesh and percentage of population with at least 9th grade education in the United States with a correlation coefficient (R) of -0.458 and weighted average of 92.4%. Similarly, the statistical analysis conducted on geographies consisting of 502,679,955 people shows a poor positive correlation between the proportion of French Canadians and percentage of population with at least 9th grade education in the United States with a correlation coefficient (R) of 0.113 and weighted average of 96.3%, a difference of 4.3%.
9th Grade Correlation Summary
| Measurement | Immigrants from Bangladesh | French Canadian |
| Minimum | 82.2% | 86.5% |
| Maximum | 100.0% | 100.0% |
| Range | 17.8% | 13.5% |
| Mean | 92.6% | 96.7% |
| Median | 93.6% | 97.0% |
| Interquartile 25% (IQ1) | 89.3% | 95.8% |
| Interquartile 75% (IQ3) | 95.3% | 98.7% |
| Interquartile Range (IQR) | 6.0% | 2.9% |
| Standard Deviation (Sample) | 4.3% | 2.9% |
| Standard Deviation (Population) | 4.3% | 2.9% |
Similar Demographics by 9th Grade
Demographics Similar to Immigrants from Bangladesh by 9th Grade
In terms of 9th grade, the demographic groups most similar to Immigrants from Bangladesh are Immigrants from Cambodia (92.4%, a difference of 0.030%), Immigrants from Fiji (92.3%, a difference of 0.050%), Houma (92.3%, a difference of 0.080%), Vietnamese (92.3%, a difference of 0.10%), and Immigrants from Portugal (92.2%, a difference of 0.14%).
| Demographics | Rating | Rank | 9th Grade |
| Immigrants | Dominica | 0.0 /100 | #302 | Tragic 92.7% |
| Guyanese | 0.0 /100 | #303 | Tragic 92.7% |
| Tohono O'odham | 0.0 /100 | #304 | Tragic 92.6% |
| Japanese | 0.0 /100 | #305 | Tragic 92.6% |
| Immigrants | Vietnam | 0.0 /100 | #306 | Tragic 92.6% |
| Immigrants | Immigrants | 0.0 /100 | #307 | Tragic 92.5% |
| Immigrants | Guyana | 0.0 /100 | #308 | Tragic 92.5% |
| Immigrants | Bangladesh | 0.0 /100 | #309 | Tragic 92.4% |
| Immigrants | Cambodia | 0.0 /100 | #310 | Tragic 92.4% |
| Immigrants | Fiji | 0.0 /100 | #311 | Tragic 92.3% |
| Houma | 0.0 /100 | #312 | Tragic 92.3% |
| Vietnamese | 0.0 /100 | #313 | Tragic 92.3% |
| Immigrants | Portugal | 0.0 /100 | #314 | Tragic 92.2% |
| Immigrants | Caribbean | 0.0 /100 | #315 | Tragic 92.2% |
| Cape Verdeans | 0.0 /100 | #316 | Tragic 92.2% |
Demographics Similar to French Canadians by 9th Grade
In terms of 9th grade, the demographic groups most similar to French Canadians are Scotch-Irish (96.3%, a difference of 0.010%), Eastern European (96.3%, a difference of 0.010%), Chinese (96.3%, a difference of 0.020%), French (96.3%, a difference of 0.030%), and Latvian (96.4%, a difference of 0.040%).
| Demographics | Rating | Rank | 9th Grade |
| Welsh | 100.0 /100 | #19 | Exceptional 96.4% |
| Italians | 100.0 /100 | #20 | Exceptional 96.4% |
| Alaskan Athabascans | 100.0 /100 | #21 | Exceptional 96.4% |
| Europeans | 100.0 /100 | #22 | Exceptional 96.4% |
| Czechs | 100.0 /100 | #23 | Exceptional 96.4% |
| Latvians | 100.0 /100 | #24 | Exceptional 96.4% |
| French | 100.0 /100 | #25 | Exceptional 96.3% |
| French Canadians | 100.0 /100 | #26 | Exceptional 96.3% |
| Scotch-Irish | 100.0 /100 | #27 | Exceptional 96.3% |
| Eastern Europeans | 100.0 /100 | #28 | Exceptional 96.3% |
| Chinese | 100.0 /100 | #29 | Exceptional 96.3% |
| Maltese | 100.0 /100 | #30 | Exceptional 96.3% |
| British | 100.0 /100 | #31 | Exceptional 96.3% |
| Belgians | 100.0 /100 | #32 | Exceptional 96.3% |
| Luxembourgers | 100.0 /100 | #33 | Exceptional 96.3% |