Immigrants from Bahamas vs Jordanian 6th Grade
COMPARE
Immigrants from Bahamas
Jordanian
6th Grade
6th Grade Comparison
Immigrants from Bahamas
Jordanians
96.8%
6TH GRADE
13.8/ 100
METRIC RATING
204th/ 347
METRIC RANK
97.2%
6TH GRADE
84.6/ 100
METRIC RATING
142nd/ 347
METRIC RANK
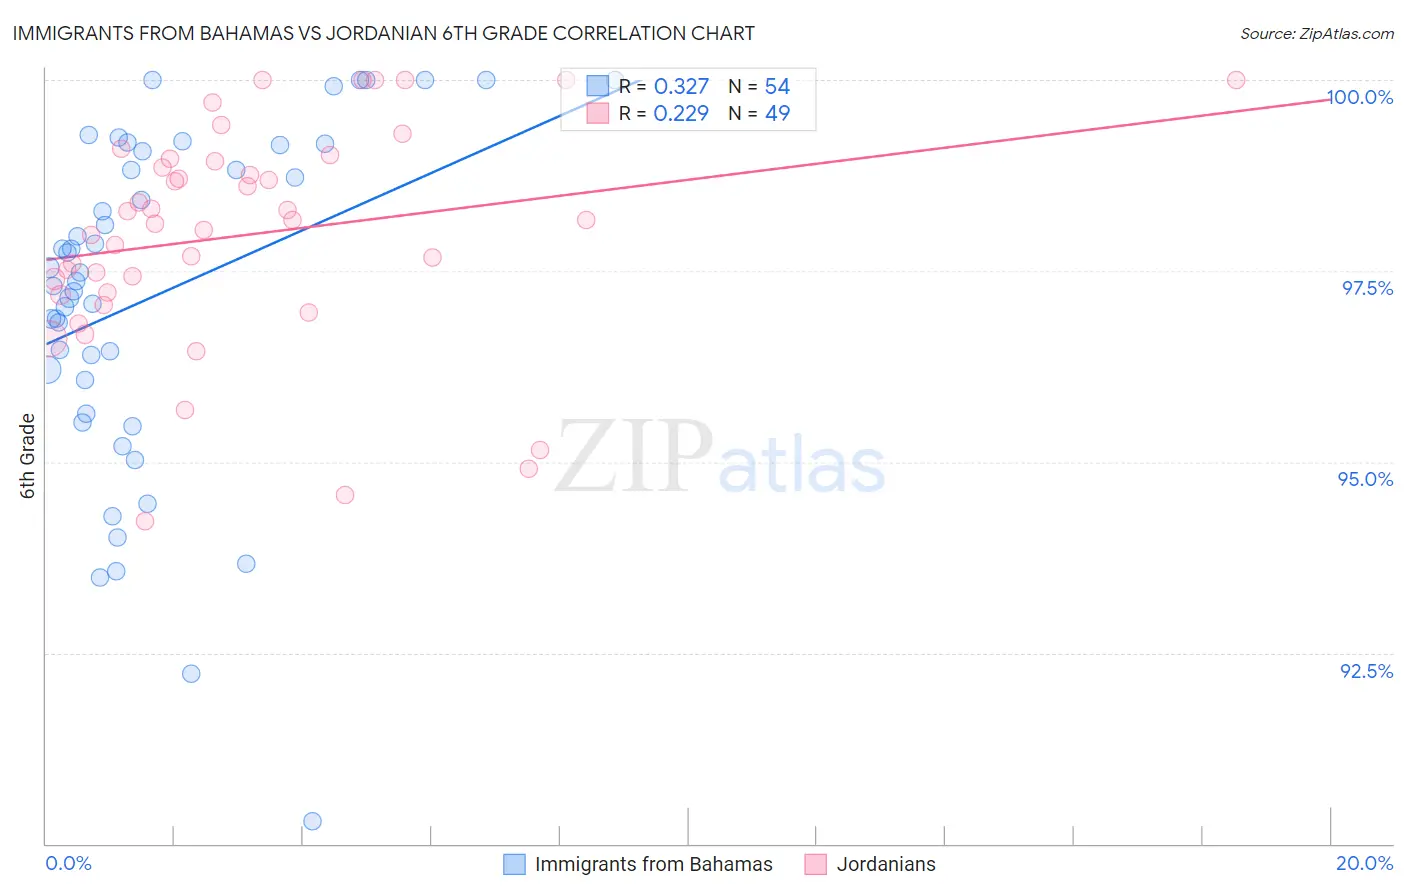
Immigrants from Bahamas vs Jordanian 6th Grade Correlation Chart
The statistical analysis conducted on geographies consisting of 104,666,801 people shows a mild positive correlation between the proportion of Immigrants from Bahamas and percentage of population with at least 6th grade education in the United States with a correlation coefficient (R) of 0.327 and weighted average of 96.8%. Similarly, the statistical analysis conducted on geographies consisting of 166,424,117 people shows a weak positive correlation between the proportion of Jordanians and percentage of population with at least 6th grade education in the United States with a correlation coefficient (R) of 0.229 and weighted average of 97.2%, a difference of 0.40%.
6th Grade Correlation Summary
| Measurement | Immigrants from Bahamas | Jordanian |
| Minimum | 90.3% | 94.2% |
| Maximum | 100.0% | 100.0% |
| Range | 9.7% | 5.8% |
| Mean | 97.2% | 98.0% |
| Median | 97.4% | 98.2% |
| Interquartile 25% (IQ1) | 96.1% | 97.2% |
| Interquartile 75% (IQ3) | 99.1% | 99.0% |
| Interquartile Range (IQR) | 3.0% | 1.7% |
| Standard Deviation (Sample) | 2.2% | 1.4% |
| Standard Deviation (Population) | 2.2% | 1.4% |
Similar Demographics by 6th Grade
Demographics Similar to Immigrants from Bahamas by 6th Grade
In terms of 6th grade, the demographic groups most similar to Immigrants from Bahamas are Immigrants from Chile (96.8%, a difference of 0.0%), Sudanese (96.8%, a difference of 0.0%), African (96.9%, a difference of 0.010%), Immigrants from Zaire (96.9%, a difference of 0.010%), and Native/Alaskan (96.8%, a difference of 0.010%).
| Demographics | Rating | Rank | 6th Grade |
| Brazilians | 20.1 /100 | #197 | Fair 96.9% |
| Immigrants | Albania | 18.8 /100 | #198 | Poor 96.9% |
| Immigrants | Northern Africa | 15.7 /100 | #199 | Poor 96.9% |
| Africans | 14.8 /100 | #200 | Poor 96.9% |
| Immigrants | Zaire | 14.5 /100 | #201 | Poor 96.9% |
| Immigrants | Chile | 14.2 /100 | #202 | Poor 96.8% |
| Sudanese | 13.9 /100 | #203 | Poor 96.8% |
| Immigrants | Bahamas | 13.8 /100 | #204 | Poor 96.8% |
| Natives/Alaskans | 13.0 /100 | #205 | Poor 96.8% |
| Laotians | 11.8 /100 | #206 | Poor 96.8% |
| Iraqis | 11.7 /100 | #207 | Poor 96.8% |
| Samoans | 11.0 /100 | #208 | Poor 96.8% |
| Immigrants | Oceania | 11.0 /100 | #209 | Poor 96.8% |
| Immigrants | Nepal | 10.1 /100 | #210 | Poor 96.8% |
| Immigrants | Iraq | 9.2 /100 | #211 | Tragic 96.8% |
Demographics Similar to Jordanians by 6th Grade
In terms of 6th grade, the demographic groups most similar to Jordanians are Seminole (97.2%, a difference of 0.0%), Immigrants from Turkey (97.3%, a difference of 0.010%), Immigrants from North Macedonia (97.2%, a difference of 0.010%), Pima (97.2%, a difference of 0.010%), and Israeli (97.2%, a difference of 0.010%).
| Demographics | Rating | Rank | 6th Grade |
| Immigrants | Hungary | 89.5 /100 | #135 | Excellent 97.3% |
| Filipinos | 88.9 /100 | #136 | Excellent 97.3% |
| Burmese | 87.8 /100 | #137 | Excellent 97.3% |
| Blackfeet | 87.7 /100 | #138 | Excellent 97.3% |
| Immigrants | Turkey | 86.1 /100 | #139 | Excellent 97.3% |
| Immigrants | North Macedonia | 85.5 /100 | #140 | Excellent 97.2% |
| Seminole | 84.8 /100 | #141 | Excellent 97.2% |
| Jordanians | 84.6 /100 | #142 | Excellent 97.2% |
| Pima | 82.9 /100 | #143 | Excellent 97.2% |
| Israelis | 82.9 /100 | #144 | Excellent 97.2% |
| Spaniards | 80.1 /100 | #145 | Excellent 97.2% |
| Hopi | 78.8 /100 | #146 | Good 97.2% |
| Immigrants | South Central Asia | 78.1 /100 | #147 | Good 97.2% |
| Immigrants | Greece | 77.8 /100 | #148 | Good 97.2% |
| Immigrants | Israel | 76.0 /100 | #149 | Good 97.2% |