Immigrants from Bahamas vs Immigrants from South Africa Master's Degree
COMPARE
Immigrants from Bahamas
Immigrants from South Africa
Master's Degree
Master's Degree Comparison
Immigrants from Bahamas
Immigrants from South Africa
12.9%
MASTER'S DEGREE
1.4/ 100
METRIC RATING
245th/ 347
METRIC RANK
18.8%
MASTER'S DEGREE
100.0/ 100
METRIC RATING
51st/ 347
METRIC RANK
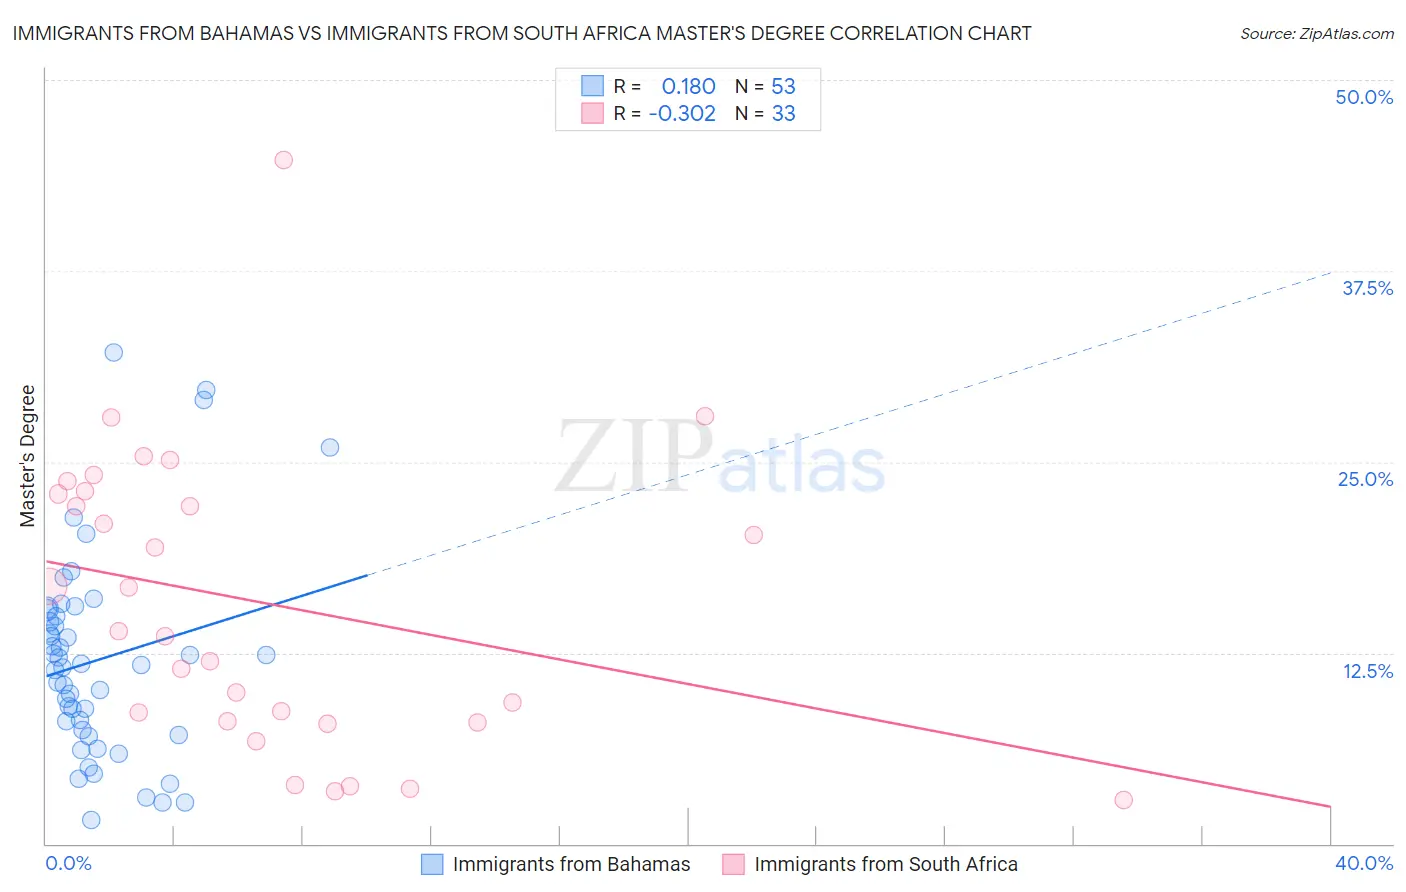
Immigrants from Bahamas vs Immigrants from South Africa Master's Degree Correlation Chart
The statistical analysis conducted on geographies consisting of 104,646,319 people shows a poor positive correlation between the proportion of Immigrants from Bahamas and percentage of population with at least master's degree education in the United States with a correlation coefficient (R) of 0.180 and weighted average of 12.9%. Similarly, the statistical analysis conducted on geographies consisting of 233,295,718 people shows a mild negative correlation between the proportion of Immigrants from South Africa and percentage of population with at least master's degree education in the United States with a correlation coefficient (R) of -0.302 and weighted average of 18.8%, a difference of 45.3%.
Master's Degree Correlation Summary
| Measurement | Immigrants from Bahamas | Immigrants from South Africa |
| Minimum | 1.6% | 2.9% |
| Maximum | 32.1% | 44.8% |
| Range | 30.6% | 41.9% |
| Mean | 12.0% | 15.7% |
| Median | 11.7% | 13.9% |
| Interquartile 25% (IQ1) | 7.3% | 8.0% |
| Interquartile 75% (IQ3) | 15.1% | 23.0% |
| Interquartile Range (IQR) | 7.9% | 15.0% |
| Standard Deviation (Sample) | 6.7% | 9.6% |
| Standard Deviation (Population) | 6.7% | 9.4% |
Similar Demographics by Master's Degree
Demographics Similar to Immigrants from Bahamas by Master's Degree
In terms of master's degree, the demographic groups most similar to Immigrants from Bahamas are Immigrants from Cambodia (12.9%, a difference of 0.040%), Iroquois (12.9%, a difference of 0.070%), African (12.9%, a difference of 0.16%), Cree (12.8%, a difference of 0.47%), and Liberian (12.8%, a difference of 0.47%).
| Demographics | Rating | Rank | Master's Degree |
| Hmong | 4.0 /100 | #238 | Tragic 13.4% |
| Immigrants | Nonimmigrants | 3.4 /100 | #239 | Tragic 13.3% |
| Guamanians/Chamorros | 2.2 /100 | #240 | Tragic 13.1% |
| U.S. Virgin Islanders | 2.1 /100 | #241 | Tragic 13.1% |
| Spanish Americans | 1.9 /100 | #242 | Tragic 13.0% |
| Immigrants | Jamaica | 1.9 /100 | #243 | Tragic 13.0% |
| Delaware | 1.7 /100 | #244 | Tragic 13.0% |
| Immigrants | Bahamas | 1.4 /100 | #245 | Tragic 12.9% |
| Immigrants | Cambodia | 1.4 /100 | #246 | Tragic 12.9% |
| Iroquois | 1.4 /100 | #247 | Tragic 12.9% |
| Africans | 1.4 /100 | #248 | Tragic 12.9% |
| Cree | 1.3 /100 | #249 | Tragic 12.8% |
| Liberians | 1.3 /100 | #250 | Tragic 12.8% |
| Tlingit-Haida | 1.3 /100 | #251 | Tragic 12.8% |
| French American Indians | 1.0 /100 | #252 | Tragic 12.7% |
Demographics Similar to Immigrants from South Africa by Master's Degree
In terms of master's degree, the demographic groups most similar to Immigrants from South Africa are Bulgarian (18.8%, a difference of 0.010%), Estonian (18.8%, a difference of 0.20%), Paraguayan (18.8%, a difference of 0.30%), Immigrants from Austria (18.8%, a difference of 0.35%), and Immigrants from Norway (18.8%, a difference of 0.37%).
| Demographics | Rating | Rank | Master's Degree |
| Immigrants | Malaysia | 100.0 /100 | #44 | Exceptional 18.9% |
| Immigrants | Belarus | 100.0 /100 | #45 | Exceptional 18.9% |
| Immigrants | Norway | 100.0 /100 | #46 | Exceptional 18.8% |
| Immigrants | Austria | 100.0 /100 | #47 | Exceptional 18.8% |
| Paraguayans | 100.0 /100 | #48 | Exceptional 18.8% |
| Estonians | 100.0 /100 | #49 | Exceptional 18.8% |
| Bulgarians | 100.0 /100 | #50 | Exceptional 18.8% |
| Immigrants | South Africa | 100.0 /100 | #51 | Exceptional 18.8% |
| Immigrants | Kuwait | 100.0 /100 | #52 | Exceptional 18.6% |
| Immigrants | Czechoslovakia | 99.9 /100 | #53 | Exceptional 18.5% |
| Immigrants | Lithuania | 99.9 /100 | #54 | Exceptional 18.5% |
| Immigrants | Serbia | 99.9 /100 | #55 | Exceptional 18.5% |
| Asians | 99.9 /100 | #56 | Exceptional 18.4% |
| Immigrants | Asia | 99.9 /100 | #57 | Exceptional 18.4% |
| Australians | 99.9 /100 | #58 | Exceptional 18.4% |