Immigrants from Bahamas vs Immigrants from Peru College, Under 1 year
COMPARE
Immigrants from Bahamas
Immigrants from Peru
College, Under 1 year
College, Under 1 year Comparison
Immigrants from Bahamas
Immigrants from Peru
61.1%
COLLEGE, UNDER 1 YEAR
0.2/ 100
METRIC RATING
265th/ 347
METRIC RANK
63.1%
COLLEGE, UNDER 1 YEAR
4.0/ 100
METRIC RATING
225th/ 347
METRIC RANK
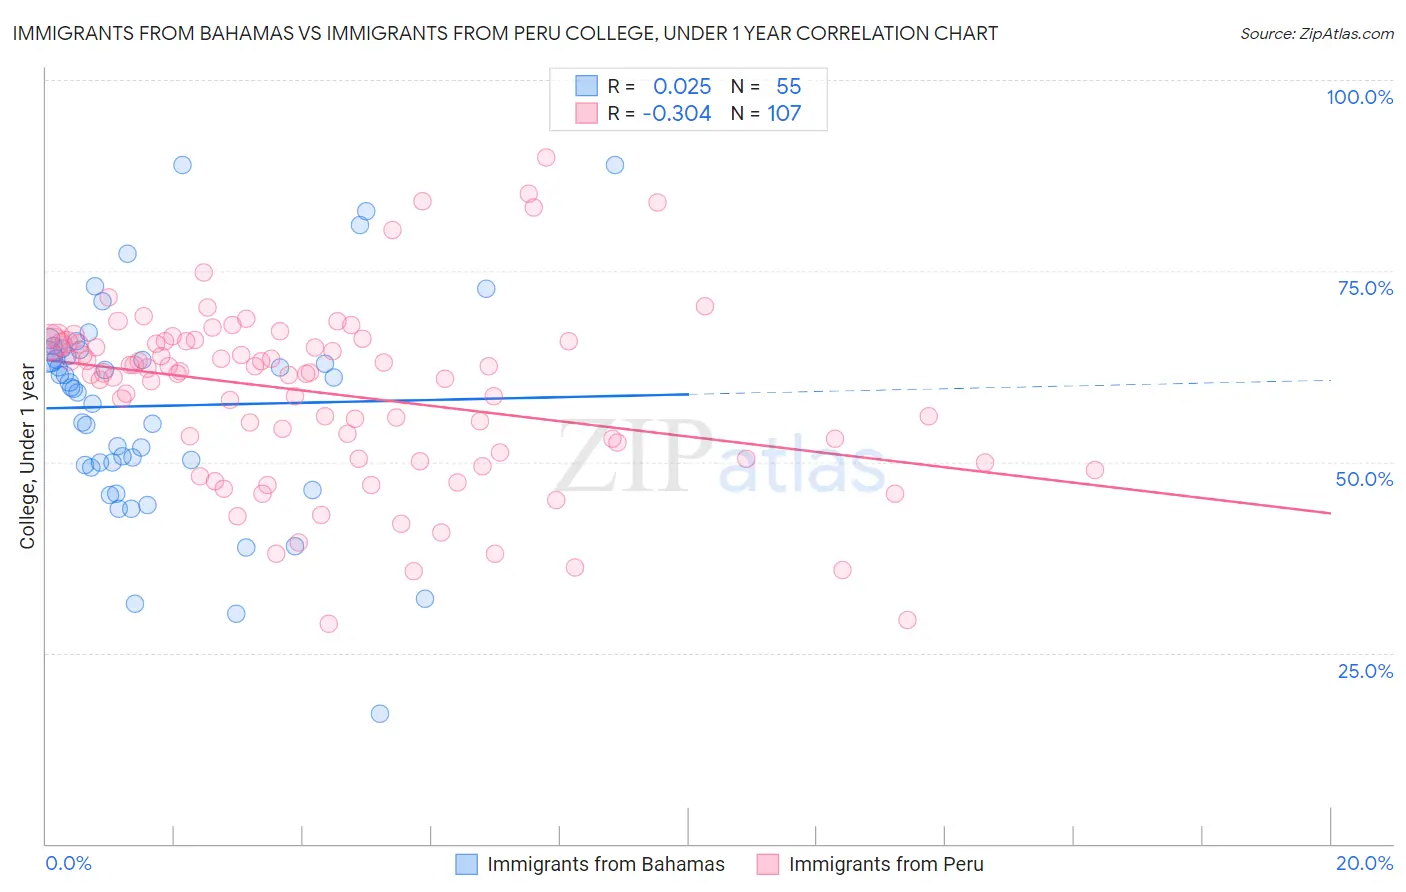
Immigrants from Bahamas vs Immigrants from Peru College, Under 1 year Correlation Chart
The statistical analysis conducted on geographies consisting of 104,668,341 people shows no correlation between the proportion of Immigrants from Bahamas and percentage of population with at least college, under 1 year education in the United States with a correlation coefficient (R) of 0.025 and weighted average of 61.1%. Similarly, the statistical analysis conducted on geographies consisting of 328,860,969 people shows a mild negative correlation between the proportion of Immigrants from Peru and percentage of population with at least college, under 1 year education in the United States with a correlation coefficient (R) of -0.304 and weighted average of 63.1%, a difference of 3.4%.
College, Under 1 year Correlation Summary
| Measurement | Immigrants from Bahamas | Immigrants from Peru |
| Minimum | 17.1% | 28.8% |
| Maximum | 88.9% | 89.8% |
| Range | 71.8% | 61.0% |
| Mean | 57.3% | 58.9% |
| Median | 59.8% | 61.6% |
| Interquartile 25% (IQ1) | 49.6% | 50.5% |
| Interquartile 75% (IQ3) | 64.6% | 65.7% |
| Interquartile Range (IQR) | 15.0% | 15.3% |
| Standard Deviation (Sample) | 14.1% | 11.6% |
| Standard Deviation (Population) | 14.0% | 11.6% |
Similar Demographics by College, Under 1 year
Demographics Similar to Immigrants from Bahamas by College, Under 1 year
In terms of college, under 1 year, the demographic groups most similar to Immigrants from Bahamas are Trinidadian and Tobagonian (61.1%, a difference of 0.0%), Shoshone (61.1%, a difference of 0.060%), Barbadian (61.1%, a difference of 0.070%), African (61.1%, a difference of 0.11%), and Alaskan Athabascan (61.0%, a difference of 0.12%).
| Demographics | Rating | Rank | College, Under 1 year |
| Immigrants | Bangladesh | 0.3 /100 | #258 | Tragic 61.3% |
| Indonesians | 0.3 /100 | #259 | Tragic 61.2% |
| Blackfeet | 0.3 /100 | #260 | Tragic 61.1% |
| Africans | 0.3 /100 | #261 | Tragic 61.1% |
| Barbadians | 0.2 /100 | #262 | Tragic 61.1% |
| Shoshone | 0.2 /100 | #263 | Tragic 61.1% |
| Trinidadians and Tobagonians | 0.2 /100 | #264 | Tragic 61.1% |
| Immigrants | Bahamas | 0.2 /100 | #265 | Tragic 61.1% |
| Alaskan Athabascans | 0.2 /100 | #266 | Tragic 61.0% |
| Americans | 0.2 /100 | #267 | Tragic 61.0% |
| Immigrants | Trinidad and Tobago | 0.1 /100 | #268 | Tragic 60.7% |
| Immigrants | West Indies | 0.1 /100 | #269 | Tragic 60.6% |
| Cheyenne | 0.1 /100 | #270 | Tragic 60.6% |
| U.S. Virgin Islanders | 0.1 /100 | #271 | Tragic 60.6% |
| Jamaicans | 0.1 /100 | #272 | Tragic 60.5% |
Demographics Similar to Immigrants from Peru by College, Under 1 year
In terms of college, under 1 year, the demographic groups most similar to Immigrants from Peru are Immigrants from Colombia (63.1%, a difference of 0.020%), Subsaharan African (63.2%, a difference of 0.10%), Immigrants from Ghana (63.1%, a difference of 0.11%), Immigrants from Costa Rica (63.2%, a difference of 0.13%), and Samoan (63.0%, a difference of 0.22%).
| Demographics | Rating | Rank | College, Under 1 year |
| Immigrants | Panama | 5.7 /100 | #218 | Tragic 63.4% |
| Immigrants | Fiji | 5.7 /100 | #219 | Tragic 63.4% |
| Portuguese | 5.6 /100 | #220 | Tragic 63.4% |
| Cree | 5.2 /100 | #221 | Tragic 63.3% |
| Immigrants | Senegal | 5.0 /100 | #222 | Tragic 63.3% |
| Immigrants | Costa Rica | 4.5 /100 | #223 | Tragic 63.2% |
| Sub-Saharan Africans | 4.4 /100 | #224 | Tragic 63.2% |
| Immigrants | Peru | 4.0 /100 | #225 | Tragic 63.1% |
| Immigrants | Colombia | 4.0 /100 | #226 | Tragic 63.1% |
| Immigrants | Ghana | 3.7 /100 | #227 | Tragic 63.1% |
| Samoans | 3.3 /100 | #228 | Tragic 63.0% |
| Liberians | 3.2 /100 | #229 | Tragic 63.0% |
| Immigrants | Nonimmigrants | 3.0 /100 | #230 | Tragic 62.9% |
| Immigrants | Western Africa | 2.4 /100 | #231 | Tragic 62.8% |
| Osage | 2.2 /100 | #232 | Tragic 62.7% |