Immigrants from the Azores vs Immigrants from Cuba 12th Grade, No Diploma
COMPARE
Immigrants from the Azores
Immigrants from Cuba
12th Grade, No Diploma
12th Grade, No Diploma Comparison
Immigrants from the Azores
Immigrants from Cuba
85.3%
12TH GRADE, NO DIPLOMA
0.0/ 100
METRIC RATING
330th/ 347
METRIC RANK
87.5%
12TH GRADE, NO DIPLOMA
0.0/ 100
METRIC RATING
310th/ 347
METRIC RANK
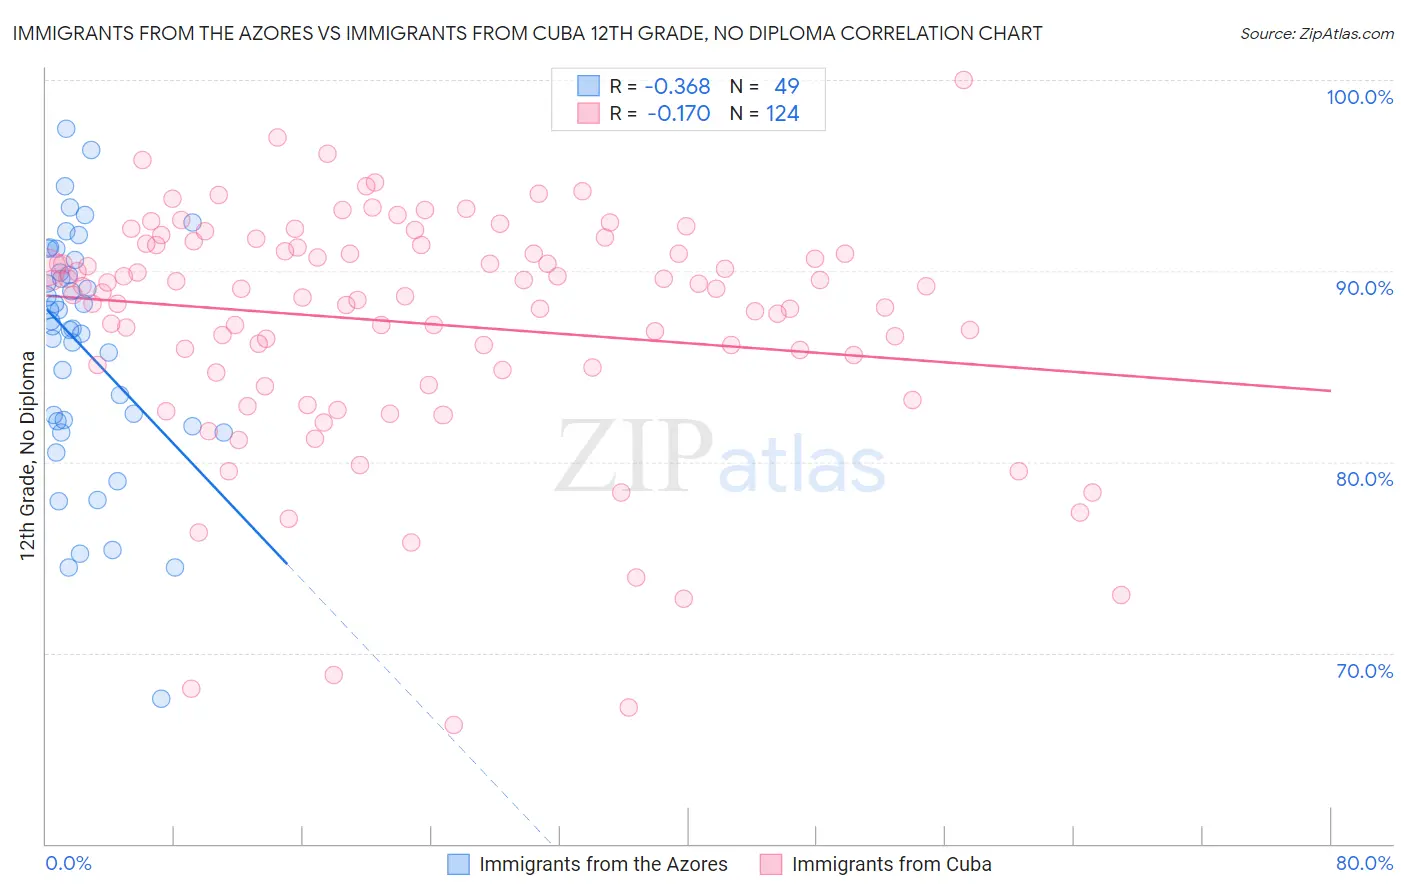
Immigrants from the Azores vs Immigrants from Cuba 12th Grade, No Diploma Correlation Chart
The statistical analysis conducted on geographies consisting of 46,257,310 people shows a mild negative correlation between the proportion of Immigrants from the Azores and percentage of population with at least 12th grade (no diploma) education in the United States with a correlation coefficient (R) of -0.368 and weighted average of 85.3%. Similarly, the statistical analysis conducted on geographies consisting of 326,028,015 people shows a poor negative correlation between the proportion of Immigrants from Cuba and percentage of population with at least 12th grade (no diploma) education in the United States with a correlation coefficient (R) of -0.170 and weighted average of 87.5%, a difference of 2.6%.
12th Grade, No Diploma Correlation Summary
| Measurement | Immigrants from the Azores | Immigrants from Cuba |
| Minimum | 67.6% | 66.2% |
| Maximum | 97.5% | 100.0% |
| Range | 29.9% | 33.8% |
| Mean | 85.9% | 87.3% |
| Median | 87.1% | 89.0% |
| Interquartile 25% (IQ1) | 82.0% | 84.9% |
| Interquartile 75% (IQ3) | 90.2% | 91.3% |
| Interquartile Range (IQR) | 8.2% | 6.4% |
| Standard Deviation (Sample) | 6.3% | 6.2% |
| Standard Deviation (Population) | 6.2% | 6.2% |
Demographics Similar to Immigrants from the Azores and Immigrants from Cuba by 12th Grade, No Diploma
In terms of 12th grade, no diploma, the demographic groups most similar to Immigrants from the Azores are Hispanic or Latino (85.4%, a difference of 0.14%), Honduran (85.5%, a difference of 0.23%), Lumbee (85.7%, a difference of 0.42%), Dominican (85.7%, a difference of 0.43%), and Mexican American Indian (85.7%, a difference of 0.45%). Similarly, the demographic groups most similar to Immigrants from Cuba are Yaqui (87.5%, a difference of 0.040%), Immigrants from Ecuador (87.5%, a difference of 0.050%), Immigrants from Caribbean (87.4%, a difference of 0.16%), Cape Verdean (87.4%, a difference of 0.18%), and Nicaraguan (87.3%, a difference of 0.21%).
| Demographics | Rating | Rank | 12th Grade, No Diploma |
| Immigrants | Cuba | 0.0 /100 | #310 | Tragic 87.5% |
| Yaqui | 0.0 /100 | #311 | Tragic 87.5% |
| Immigrants | Ecuador | 0.0 /100 | #312 | Tragic 87.5% |
| Immigrants | Caribbean | 0.0 /100 | #313 | Tragic 87.4% |
| Cape Verdeans | 0.0 /100 | #314 | Tragic 87.4% |
| Nicaraguans | 0.0 /100 | #315 | Tragic 87.3% |
| Apache | 0.0 /100 | #316 | Tragic 87.3% |
| Navajo | 0.0 /100 | #317 | Tragic 87.1% |
| Belizeans | 0.0 /100 | #318 | Tragic 87.0% |
| Immigrants | Belize | 0.0 /100 | #319 | Tragic 87.0% |
| Immigrants | Nicaragua | 0.0 /100 | #320 | Tragic 86.6% |
| Puerto Ricans | 0.0 /100 | #321 | Tragic 86.5% |
| Central American Indians | 0.0 /100 | #322 | Tragic 86.5% |
| Yuman | 0.0 /100 | #323 | Tragic 86.5% |
| Immigrants | Cabo Verde | 0.0 /100 | #324 | Tragic 85.8% |
| Mexican American Indians | 0.0 /100 | #325 | Tragic 85.7% |
| Dominicans | 0.0 /100 | #326 | Tragic 85.7% |
| Lumbee | 0.0 /100 | #327 | Tragic 85.7% |
| Hondurans | 0.0 /100 | #328 | Tragic 85.5% |
| Hispanics or Latinos | 0.0 /100 | #329 | Tragic 85.4% |
| Immigrants | Azores | 0.0 /100 | #330 | Tragic 85.3% |