Immigrants from the Azores vs Guamanian/Chamorro 5th Grade
COMPARE
Immigrants from the Azores
Guamanian/Chamorro
5th Grade
5th Grade Comparison
Immigrants from the Azores
Guamanians/Chamorros
95.1%
5TH GRADE
0.0/ 100
METRIC RATING
336th/ 347
METRIC RANK
97.2%
5TH GRADE
26.8/ 100
METRIC RATING
195th/ 347
METRIC RANK
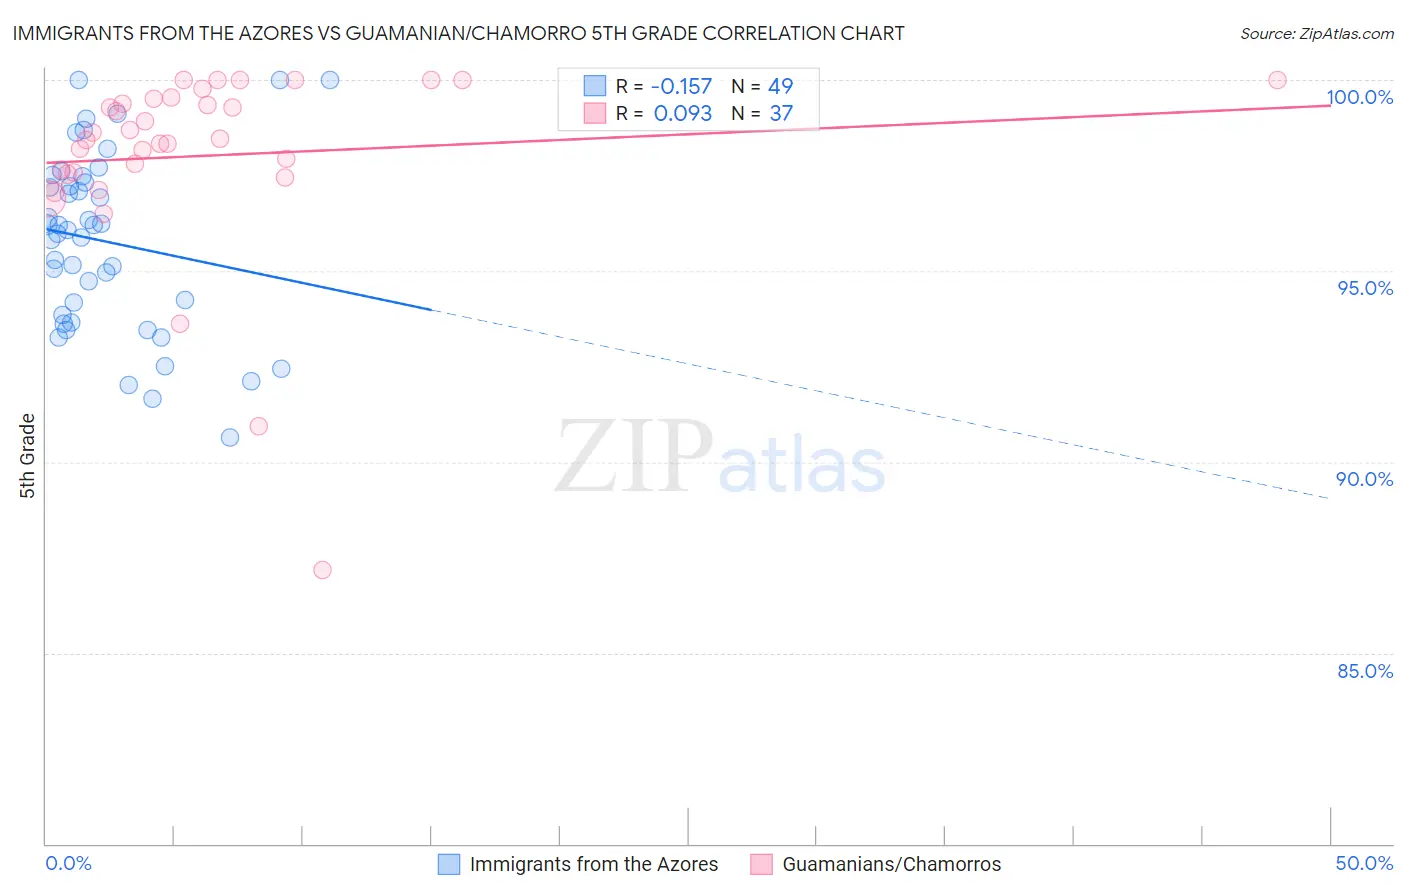
Immigrants from the Azores vs Guamanian/Chamorro 5th Grade Correlation Chart
The statistical analysis conducted on geographies consisting of 46,257,310 people shows a poor negative correlation between the proportion of Immigrants from the Azores and percentage of population with at least 5th grade education in the United States with a correlation coefficient (R) of -0.157 and weighted average of 95.1%. Similarly, the statistical analysis conducted on geographies consisting of 221,965,618 people shows a slight positive correlation between the proportion of Guamanians/Chamorros and percentage of population with at least 5th grade education in the United States with a correlation coefficient (R) of 0.093 and weighted average of 97.2%, a difference of 2.2%.
5th Grade Correlation Summary
| Measurement | Immigrants from the Azores | Guamanian/Chamorro |
| Minimum | 90.6% | 87.2% |
| Maximum | 100.0% | 100.0% |
| Range | 9.4% | 12.8% |
| Mean | 95.8% | 98.0% |
| Median | 96.1% | 98.5% |
| Interquartile 25% (IQ1) | 93.8% | 97.5% |
| Interquartile 75% (IQ3) | 97.4% | 99.5% |
| Interquartile Range (IQR) | 3.6% | 2.0% |
| Standard Deviation (Sample) | 2.3% | 2.6% |
| Standard Deviation (Population) | 2.3% | 2.5% |
Similar Demographics by 5th Grade
Demographics Similar to Immigrants from the Azores by 5th Grade
In terms of 5th grade, the demographic groups most similar to Immigrants from the Azores are Central American (95.1%, a difference of 0.070%), Mexican (95.2%, a difference of 0.10%), Nepalese (95.2%, a difference of 0.13%), Immigrants from Dominican Republic (95.3%, a difference of 0.16%), and Immigrants from Latin America (95.3%, a difference of 0.16%).
| Demographics | Rating | Rank | 5th Grade |
| Mexican American Indians | 0.0 /100 | #329 | Tragic 95.5% |
| Immigrants | Armenia | 0.0 /100 | #330 | Tragic 95.4% |
| Immigrants | Honduras | 0.0 /100 | #331 | Tragic 95.4% |
| Immigrants | Dominican Republic | 0.0 /100 | #332 | Tragic 95.3% |
| Immigrants | Latin America | 0.0 /100 | #333 | Tragic 95.3% |
| Nepalese | 0.0 /100 | #334 | Tragic 95.2% |
| Mexicans | 0.0 /100 | #335 | Tragic 95.2% |
| Immigrants | Azores | 0.0 /100 | #336 | Tragic 95.1% |
| Central Americans | 0.0 /100 | #337 | Tragic 95.1% |
| Immigrants | Cabo Verde | 0.0 /100 | #338 | Tragic 94.9% |
| Immigrants | Yemen | 0.0 /100 | #339 | Tragic 94.9% |
| Guatemalans | 0.0 /100 | #340 | Tragic 94.8% |
| Yakama | 0.0 /100 | #341 | Tragic 94.8% |
| Immigrants | Central America | 0.0 /100 | #342 | Tragic 94.7% |
| Salvadorans | 0.0 /100 | #343 | Tragic 94.6% |
Demographics Similar to Guamanians/Chamorros by 5th Grade
In terms of 5th grade, the demographic groups most similar to Guamanians/Chamorros are Navajo (97.2%, a difference of 0.010%), Immigrants from Albania (97.2%, a difference of 0.010%), Hawaiian (97.2%, a difference of 0.010%), Brazilian (97.2%, a difference of 0.010%), and Immigrants from Brazil (97.3%, a difference of 0.020%).
| Demographics | Rating | Rank | 5th Grade |
| Paraguayans | 33.7 /100 | #188 | Fair 97.3% |
| Immigrants | Egypt | 32.9 /100 | #189 | Fair 97.3% |
| Blacks/African Americans | 31.8 /100 | #190 | Fair 97.3% |
| Immigrants | Brazil | 31.5 /100 | #191 | Fair 97.3% |
| Panamanians | 31.3 /100 | #192 | Fair 97.3% |
| Navajo | 29.0 /100 | #193 | Fair 97.2% |
| Immigrants | Albania | 28.5 /100 | #194 | Fair 97.2% |
| Guamanians/Chamorros | 26.8 /100 | #195 | Fair 97.2% |
| Hawaiians | 25.6 /100 | #196 | Fair 97.2% |
| Brazilians | 25.4 /100 | #197 | Fair 97.2% |
| Immigrants | Uganda | 21.1 /100 | #198 | Fair 97.2% |
| Natives/Alaskans | 18.0 /100 | #199 | Poor 97.2% |
| Immigrants | Northern Africa | 16.8 /100 | #200 | Poor 97.2% |
| Immigrants | Chile | 16.6 /100 | #201 | Poor 97.2% |
| Africans | 15.3 /100 | #202 | Poor 97.2% |