Immigrants from Austria vs Crow 10th Grade
COMPARE
Immigrants from Austria
Crow
10th Grade
10th Grade Comparison
Immigrants from Austria
Crow
95.1%
10TH GRADE
99.9/ 100
METRIC RATING
49th/ 347
METRIC RANK
94.7%
10TH GRADE
99.0/ 100
METRIC RATING
85th/ 347
METRIC RANK
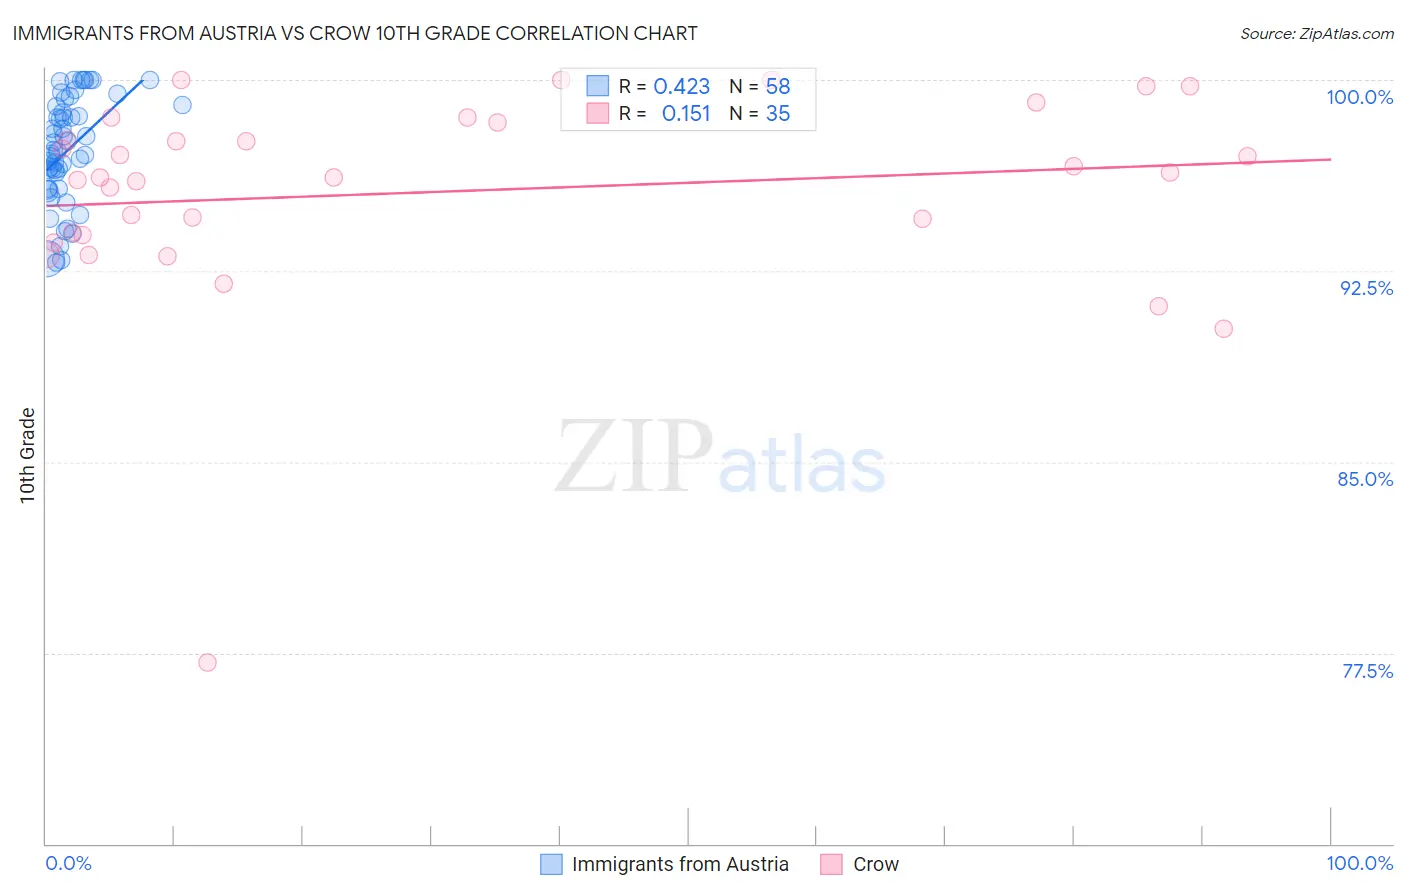
Immigrants from Austria vs Crow 10th Grade Correlation Chart
The statistical analysis conducted on geographies consisting of 167,973,618 people shows a moderate positive correlation between the proportion of Immigrants from Austria and percentage of population with at least 10th grade education in the United States with a correlation coefficient (R) of 0.423 and weighted average of 95.1%. Similarly, the statistical analysis conducted on geographies consisting of 59,209,940 people shows a poor positive correlation between the proportion of Crow and percentage of population with at least 10th grade education in the United States with a correlation coefficient (R) of 0.151 and weighted average of 94.7%, a difference of 0.42%.
10th Grade Correlation Summary
| Measurement | Immigrants from Austria | Crow |
| Minimum | 92.8% | 77.1% |
| Maximum | 100.0% | 100.0% |
| Range | 7.2% | 22.9% |
| Mean | 97.2% | 95.6% |
| Median | 97.2% | 96.2% |
| Interquartile 25% (IQ1) | 95.7% | 93.9% |
| Interquartile 75% (IQ3) | 98.9% | 98.3% |
| Interquartile Range (IQR) | 3.2% | 4.4% |
| Standard Deviation (Sample) | 2.1% | 4.1% |
| Standard Deviation (Population) | 2.0% | 4.1% |
Similar Demographics by 10th Grade
Demographics Similar to Immigrants from Austria by 10th Grade
In terms of 10th grade, the demographic groups most similar to Immigrants from Austria are Australian (95.1%, a difference of 0.030%), Immigrants from Canada (95.1%, a difference of 0.030%), Austrian (95.1%, a difference of 0.030%), Serbian (95.1%, a difference of 0.040%), and Ottawa (95.1%, a difference of 0.040%).
| Demographics | Rating | Rank | 10th Grade |
| Slavs | 99.9 /100 | #42 | Exceptional 95.2% |
| Macedonians | 99.9 /100 | #43 | Exceptional 95.2% |
| Immigrants | Northern Europe | 99.9 /100 | #44 | Exceptional 95.2% |
| Greeks | 99.9 /100 | #45 | Exceptional 95.2% |
| Czechoslovakians | 99.9 /100 | #46 | Exceptional 95.1% |
| Serbians | 99.9 /100 | #47 | Exceptional 95.1% |
| Australians | 99.9 /100 | #48 | Exceptional 95.1% |
| Immigrants | Austria | 99.9 /100 | #49 | Exceptional 95.1% |
| Immigrants | Canada | 99.8 /100 | #50 | Exceptional 95.1% |
| Austrians | 99.8 /100 | #51 | Exceptional 95.1% |
| Ottawa | 99.8 /100 | #52 | Exceptional 95.1% |
| Immigrants | North America | 99.8 /100 | #53 | Exceptional 95.0% |
| Immigrants | Lithuania | 99.8 /100 | #54 | Exceptional 95.0% |
| Immigrants | Ireland | 99.8 /100 | #55 | Exceptional 95.0% |
| New Zealanders | 99.8 /100 | #56 | Exceptional 95.0% |
Demographics Similar to Crow by 10th Grade
In terms of 10th grade, the demographic groups most similar to Crow are Puget Sound Salish (94.7%, a difference of 0.0%), Immigrants from Western Europe (94.7%, a difference of 0.010%), Icelander (94.7%, a difference of 0.010%), Immigrants from Saudi Arabia (94.7%, a difference of 0.010%), and Immigrants from Japan (94.7%, a difference of 0.010%).
| Demographics | Rating | Rank | 10th Grade |
| Filipinos | 99.3 /100 | #78 | Exceptional 94.8% |
| Immigrants | Czechoslovakia | 99.2 /100 | #79 | Exceptional 94.7% |
| Immigrants | Denmark | 99.2 /100 | #80 | Exceptional 94.7% |
| Immigrants | Latvia | 99.2 /100 | #81 | Exceptional 94.7% |
| Swiss | 99.1 /100 | #82 | Exceptional 94.7% |
| Immigrants | Western Europe | 99.1 /100 | #83 | Exceptional 94.7% |
| Icelanders | 99.1 /100 | #84 | Exceptional 94.7% |
| Crow | 99.0 /100 | #85 | Exceptional 94.7% |
| Puget Sound Salish | 99.0 /100 | #86 | Exceptional 94.7% |
| Immigrants | Saudi Arabia | 99.0 /100 | #87 | Exceptional 94.7% |
| Immigrants | Japan | 99.0 /100 | #88 | Exceptional 94.7% |
| Immigrants | Moldova | 98.9 /100 | #89 | Exceptional 94.7% |
| South Africans | 98.8 /100 | #90 | Exceptional 94.7% |
| Whites/Caucasians | 98.8 /100 | #91 | Exceptional 94.7% |
| Yugoslavians | 98.4 /100 | #92 | Exceptional 94.6% |