Immigrants from Australia vs Nigerian Associate's Degree
COMPARE
Immigrants from Australia
Nigerian
Associate's Degree
Associate's Degree Comparison
Immigrants from Australia
Nigerians
55.8%
ASSOCIATE'S DEGREE
100.0/ 100
METRIC RATING
11th/ 347
METRIC RANK
45.1%
ASSOCIATE'S DEGREE
19.1/ 100
METRIC RATING
204th/ 347
METRIC RANK
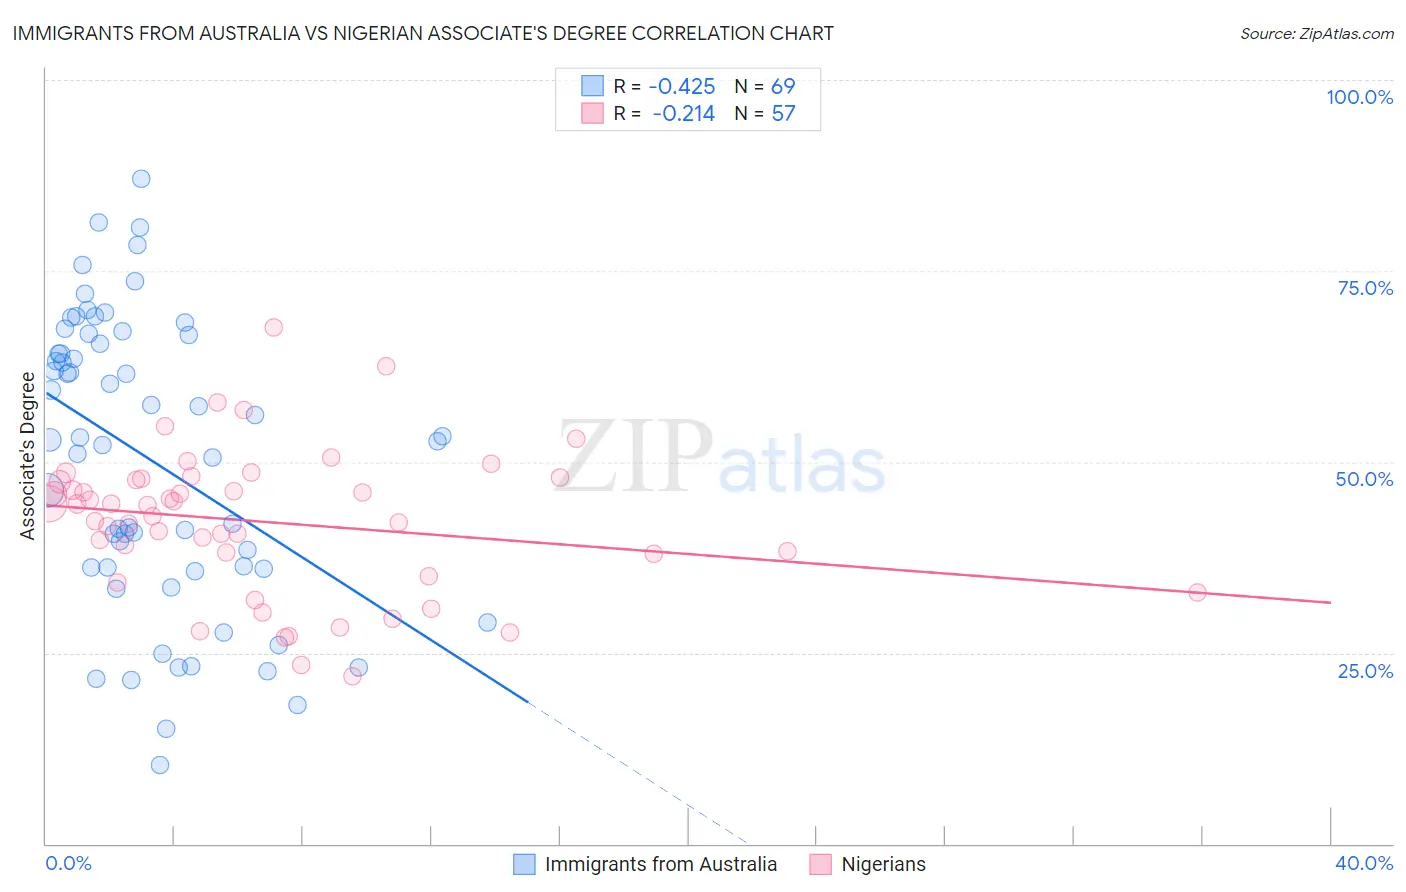
Immigrants from Australia vs Nigerian Associate's Degree Correlation Chart
The statistical analysis conducted on geographies consisting of 227,202,570 people shows a moderate negative correlation between the proportion of Immigrants from Australia and percentage of population with at least associate's degree education in the United States with a correlation coefficient (R) of -0.425 and weighted average of 55.8%. Similarly, the statistical analysis conducted on geographies consisting of 332,751,702 people shows a weak negative correlation between the proportion of Nigerians and percentage of population with at least associate's degree education in the United States with a correlation coefficient (R) of -0.214 and weighted average of 45.1%, a difference of 23.7%.
Associate's Degree Correlation Summary
| Measurement | Immigrants from Australia | Nigerian |
| Minimum | 10.3% | 22.0% |
| Maximum | 87.2% | 67.5% |
| Range | 76.8% | 45.6% |
| Mean | 50.2% | 42.1% |
| Median | 52.9% | 44.3% |
| Interquartile 25% (IQ1) | 36.0% | 36.5% |
| Interquartile 75% (IQ3) | 66.1% | 47.7% |
| Interquartile Range (IQR) | 30.0% | 11.2% |
| Standard Deviation (Sample) | 18.8% | 9.4% |
| Standard Deviation (Population) | 18.7% | 9.4% |
Similar Demographics by Associate's Degree
Demographics Similar to Immigrants from Australia by Associate's Degree
In terms of associate's degree, the demographic groups most similar to Immigrants from Australia are Immigrants from South Central Asia (55.7%, a difference of 0.12%), Immigrants from China (55.5%, a difference of 0.61%), Immigrants from Hong Kong (55.4%, a difference of 0.76%), Immigrants from Eastern Asia (55.4%, a difference of 0.79%), and Cypriot (56.4%, a difference of 1.0%).
| Demographics | Rating | Rank | Associate's Degree |
| Immigrants | Taiwan | 100.0 /100 | #4 | Exceptional 58.4% |
| Iranians | 100.0 /100 | #5 | Exceptional 58.2% |
| Okinawans | 100.0 /100 | #6 | Exceptional 57.7% |
| Immigrants | Iran | 100.0 /100 | #7 | Exceptional 57.7% |
| Thais | 100.0 /100 | #8 | Exceptional 57.4% |
| Immigrants | Israel | 100.0 /100 | #9 | Exceptional 56.8% |
| Cypriots | 100.0 /100 | #10 | Exceptional 56.4% |
| Immigrants | Australia | 100.0 /100 | #11 | Exceptional 55.8% |
| Immigrants | South Central Asia | 100.0 /100 | #12 | Exceptional 55.7% |
| Immigrants | China | 100.0 /100 | #13 | Exceptional 55.5% |
| Immigrants | Hong Kong | 100.0 /100 | #14 | Exceptional 55.4% |
| Immigrants | Eastern Asia | 100.0 /100 | #15 | Exceptional 55.4% |
| Soviet Union | 100.0 /100 | #16 | Exceptional 55.1% |
| Eastern Europeans | 100.0 /100 | #17 | Exceptional 55.0% |
| Indians (Asian) | 100.0 /100 | #18 | Exceptional 54.8% |
Demographics Similar to Nigerians by Associate's Degree
In terms of associate's degree, the demographic groups most similar to Nigerians are Immigrants from Thailand (45.1%, a difference of 0.020%), German Russian (45.1%, a difference of 0.030%), Panamanian (45.1%, a difference of 0.090%), Immigrants from South Eastern Asia (45.2%, a difference of 0.14%), and Spaniard (45.2%, a difference of 0.16%).
| Demographics | Rating | Rank | Associate's Degree |
| Scotch-Irish | 22.3 /100 | #197 | Fair 45.3% |
| Immigrants | Bangladesh | 21.3 /100 | #198 | Fair 45.2% |
| Immigrants | Senegal | 21.2 /100 | #199 | Fair 45.2% |
| Senegalese | 21.1 /100 | #200 | Fair 45.2% |
| Immigrants | Vietnam | 20.8 /100 | #201 | Fair 45.2% |
| Spaniards | 20.4 /100 | #202 | Fair 45.2% |
| Immigrants | South Eastern Asia | 20.2 /100 | #203 | Fair 45.2% |
| Nigerians | 19.1 /100 | #204 | Poor 45.1% |
| Immigrants | Thailand | 18.9 /100 | #205 | Poor 45.1% |
| German Russians | 18.9 /100 | #206 | Poor 45.1% |
| Panamanians | 18.4 /100 | #207 | Poor 45.1% |
| Dutch | 17.6 /100 | #208 | Poor 45.0% |
| Immigrants | Costa Rica | 16.7 /100 | #209 | Poor 45.0% |
| Immigrants | Philippines | 16.7 /100 | #210 | Poor 45.0% |
| Immigrants | Zaire | 16.6 /100 | #211 | Poor 45.0% |