Immigrants from Australia vs Carpatho Rusyn No Schooling Completed
COMPARE
Immigrants from Australia
Carpatho Rusyn
No Schooling Completed
No Schooling Completed Comparison
Immigrants from Australia
Carpatho Rusyns
1.7%
NO SCHOOLING COMPLETED
99.2/ 100
METRIC RATING
85th/ 347
METRIC RANK
1.4%
NO SCHOOLING COMPLETED
100.0/ 100
METRIC RATING
6th/ 347
METRIC RANK
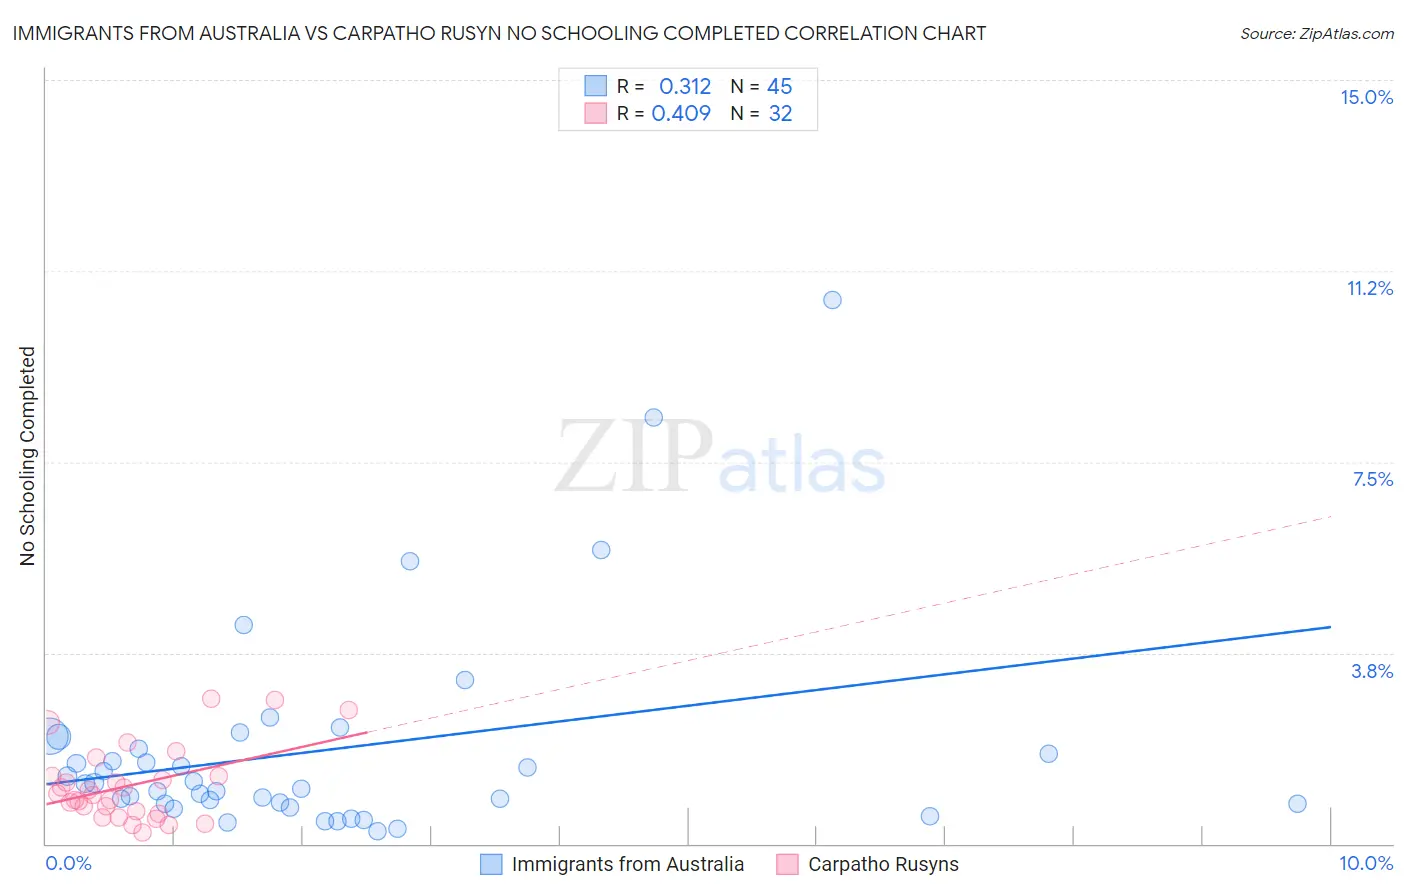
Immigrants from Australia vs Carpatho Rusyn No Schooling Completed Correlation Chart
The statistical analysis conducted on geographies consisting of 225,255,511 people shows a mild positive correlation between the proportion of Immigrants from Australia and percentage of population with no schooling in the United States with a correlation coefficient (R) of 0.312 and weighted average of 1.7%. Similarly, the statistical analysis conducted on geographies consisting of 58,721,636 people shows a moderate positive correlation between the proportion of Carpatho Rusyns and percentage of population with no schooling in the United States with a correlation coefficient (R) of 0.409 and weighted average of 1.4%, a difference of 27.5%.
No Schooling Completed Correlation Summary
| Measurement | Immigrants from Australia | Carpatho Rusyn |
| Minimum | 0.24% | 0.23% |
| Maximum | 10.7% | 2.8% |
| Range | 10.4% | 2.6% |
| Mean | 1.8% | 1.1% |
| Median | 1.2% | 0.97% |
| Interquartile 25% (IQ1) | 0.79% | 0.62% |
| Interquartile 75% (IQ3) | 2.0% | 1.3% |
| Interquartile Range (IQR) | 1.2% | 0.70% |
| Standard Deviation (Sample) | 2.1% | 0.72% |
| Standard Deviation (Population) | 2.1% | 0.71% |
Similar Demographics by No Schooling Completed
Demographics Similar to Immigrants from Australia by No Schooling Completed
In terms of no schooling completed, the demographic groups most similar to Immigrants from Australia are Immigrants from Denmark (1.7%, a difference of 0.040%), Ukrainian (1.8%, a difference of 0.050%), Potawatomi (1.7%, a difference of 0.090%), Immigrants from South Africa (1.7%, a difference of 0.20%), and Icelander (1.7%, a difference of 0.29%).
| Demographics | Rating | Rank | No Schooling Completed |
| Delaware | 99.3 /100 | #78 | Exceptional 1.7% |
| Macedonians | 99.3 /100 | #79 | Exceptional 1.7% |
| Cypriots | 99.3 /100 | #80 | Exceptional 1.7% |
| Icelanders | 99.3 /100 | #81 | Exceptional 1.7% |
| Immigrants | South Africa | 99.3 /100 | #82 | Exceptional 1.7% |
| Potawatomi | 99.3 /100 | #83 | Exceptional 1.7% |
| Immigrants | Denmark | 99.2 /100 | #84 | Exceptional 1.7% |
| Immigrants | Australia | 99.2 /100 | #85 | Exceptional 1.7% |
| Ukrainians | 99.2 /100 | #86 | Exceptional 1.8% |
| Osage | 99.2 /100 | #87 | Exceptional 1.8% |
| Immigrants | Western Europe | 99.2 /100 | #88 | Exceptional 1.8% |
| South Africans | 99.1 /100 | #89 | Exceptional 1.8% |
| Sioux | 99.0 /100 | #90 | Exceptional 1.8% |
| Immigrants | Germany | 99.0 /100 | #91 | Exceptional 1.8% |
| Romanians | 98.8 /100 | #92 | Exceptional 1.8% |
Demographics Similar to Carpatho Rusyns by No Schooling Completed
In terms of no schooling completed, the demographic groups most similar to Carpatho Rusyns are Slovene (1.4%, a difference of 0.82%), English (1.4%, a difference of 0.97%), German (1.4%, a difference of 1.2%), Norwegian (1.3%, a difference of 1.8%), and Slovak (1.3%, a difference of 2.2%).
| Demographics | Rating | Rank | No Schooling Completed |
| Yup'ik | 100.0 /100 | #1 | Exceptional 1.2% |
| Slovaks | 100.0 /100 | #2 | Exceptional 1.3% |
| Norwegians | 100.0 /100 | #3 | Exceptional 1.3% |
| Germans | 100.0 /100 | #4 | Exceptional 1.4% |
| Slovenes | 100.0 /100 | #5 | Exceptional 1.4% |
| Carpatho Rusyns | 100.0 /100 | #6 | Exceptional 1.4% |
| English | 100.0 /100 | #7 | Exceptional 1.4% |
| Swedes | 100.0 /100 | #8 | Exceptional 1.4% |
| Scottish | 100.0 /100 | #9 | Exceptional 1.4% |
| Dutch | 100.0 /100 | #10 | Exceptional 1.4% |
| Lithuanians | 100.0 /100 | #11 | Exceptional 1.4% |
| Irish | 100.0 /100 | #12 | Exceptional 1.4% |
| Poles | 100.0 /100 | #13 | Exceptional 1.4% |
| Scotch-Irish | 100.0 /100 | #14 | Exceptional 1.5% |
| Tlingit-Haida | 100.0 /100 | #15 | Exceptional 1.5% |