Immigrants from Asia vs Yakama 5th Grade
COMPARE
Immigrants from Asia
Yakama
5th Grade
5th Grade Comparison
Immigrants from Asia
Yakama
96.9%
5TH GRADE
1.7/ 100
METRIC RATING
241st/ 347
METRIC RANK
94.8%
5TH GRADE
0.0/ 100
METRIC RATING
341st/ 347
METRIC RANK
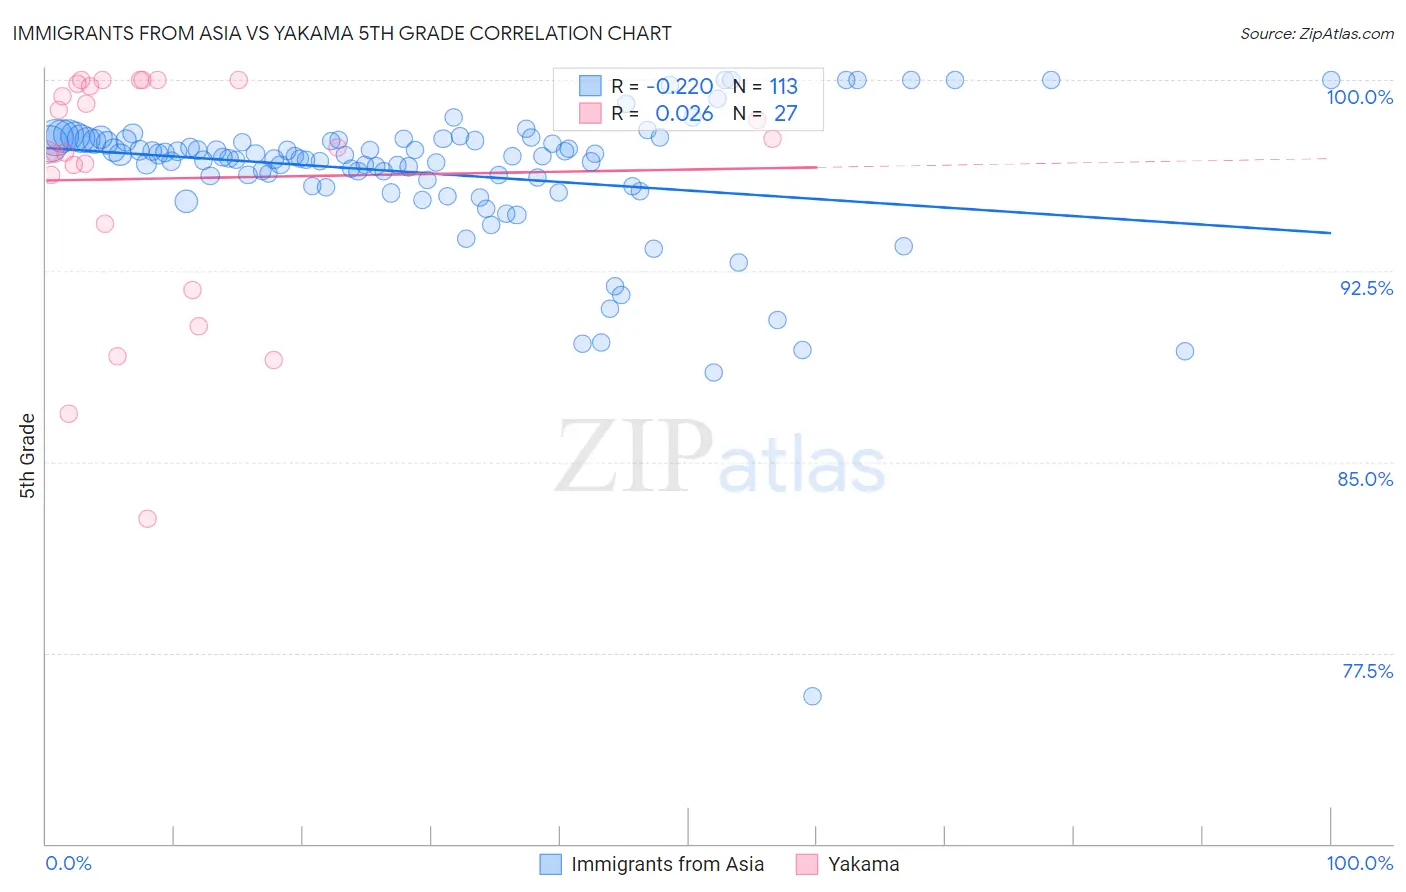
Immigrants from Asia vs Yakama 5th Grade Correlation Chart
The statistical analysis conducted on geographies consisting of 549,170,438 people shows a weak negative correlation between the proportion of Immigrants from Asia and percentage of population with at least 5th grade education in the United States with a correlation coefficient (R) of -0.220 and weighted average of 96.9%. Similarly, the statistical analysis conducted on geographies consisting of 19,923,144 people shows no correlation between the proportion of Yakama and percentage of population with at least 5th grade education in the United States with a correlation coefficient (R) of 0.026 and weighted average of 94.8%, a difference of 2.3%.
5th Grade Correlation Summary
| Measurement | Immigrants from Asia | Yakama |
| Minimum | 75.8% | 82.8% |
| Maximum | 100.0% | 100.0% |
| Range | 24.2% | 17.2% |
| Mean | 96.3% | 96.1% |
| Median | 97.0% | 97.3% |
| Interquartile 25% (IQ1) | 96.0% | 94.4% |
| Interquartile 75% (IQ3) | 97.6% | 99.9% |
| Interquartile Range (IQR) | 1.7% | 5.5% |
| Standard Deviation (Sample) | 3.0% | 4.7% |
| Standard Deviation (Population) | 3.0% | 4.6% |
Similar Demographics by 5th Grade
Demographics Similar to Immigrants from Asia by 5th Grade
In terms of 5th grade, the demographic groups most similar to Immigrants from Asia are Immigrants from Costa Rica (96.9%, a difference of 0.0%), Immigrants from Eastern Africa (96.9%, a difference of 0.0%), Indian (Asian) (96.9%, a difference of 0.010%), Korean (96.9%, a difference of 0.010%), and Immigrants from Indonesia (96.9%, a difference of 0.020%).
| Demographics | Rating | Rank | 5th Grade |
| Tohono O'odham | 3.2 /100 | #234 | Tragic 97.0% |
| Uruguayans | 3.2 /100 | #235 | Tragic 97.0% |
| Senegalese | 2.8 /100 | #236 | Tragic 97.0% |
| Immigrants | Indonesia | 2.0 /100 | #237 | Tragic 96.9% |
| Asians | 2.0 /100 | #238 | Tragic 96.9% |
| Nigerians | 1.9 /100 | #239 | Tragic 96.9% |
| Indians (Asian) | 1.9 /100 | #240 | Tragic 96.9% |
| Immigrants | Asia | 1.7 /100 | #241 | Tragic 96.9% |
| Immigrants | Costa Rica | 1.6 /100 | #242 | Tragic 96.9% |
| Immigrants | Eastern Africa | 1.6 /100 | #243 | Tragic 96.9% |
| Koreans | 1.6 /100 | #244 | Tragic 96.9% |
| Colombians | 1.3 /100 | #245 | Tragic 96.9% |
| Ethiopians | 1.2 /100 | #246 | Tragic 96.9% |
| Immigrants | Africa | 1.1 /100 | #247 | Tragic 96.9% |
| U.S. Virgin Islanders | 1.1 /100 | #248 | Tragic 96.9% |
Demographics Similar to Yakama by 5th Grade
In terms of 5th grade, the demographic groups most similar to Yakama are Guatemalan (94.8%, a difference of 0.080%), Immigrants from Yemen (94.9%, a difference of 0.10%), Immigrants from Central America (94.7%, a difference of 0.10%), Immigrants from Cabo Verde (94.9%, a difference of 0.15%), and Salvadoran (94.6%, a difference of 0.16%).
| Demographics | Rating | Rank | 5th Grade |
| Immigrants | Latin America | 0.0 /100 | #333 | Tragic 95.3% |
| Nepalese | 0.0 /100 | #334 | Tragic 95.2% |
| Mexicans | 0.0 /100 | #335 | Tragic 95.2% |
| Immigrants | Azores | 0.0 /100 | #336 | Tragic 95.1% |
| Central Americans | 0.0 /100 | #337 | Tragic 95.1% |
| Immigrants | Cabo Verde | 0.0 /100 | #338 | Tragic 94.9% |
| Immigrants | Yemen | 0.0 /100 | #339 | Tragic 94.9% |
| Guatemalans | 0.0 /100 | #340 | Tragic 94.8% |
| Yakama | 0.0 /100 | #341 | Tragic 94.8% |
| Immigrants | Central America | 0.0 /100 | #342 | Tragic 94.7% |
| Salvadorans | 0.0 /100 | #343 | Tragic 94.6% |
| Immigrants | Mexico | 0.0 /100 | #344 | Tragic 94.6% |
| Immigrants | Guatemala | 0.0 /100 | #345 | Tragic 94.6% |
| Immigrants | El Salvador | 0.0 /100 | #346 | Tragic 94.3% |
| Spanish American Indians | 0.0 /100 | #347 | Tragic 94.2% |