Immigrants from Asia vs New Zealander 3rd Grade
COMPARE
Immigrants from Asia
New Zealander
3rd Grade
3rd Grade Comparison
Immigrants from Asia
New Zealanders
97.4%
3RD GRADE
0.8/ 100
METRIC RATING
251st/ 347
METRIC RANK
98.2%
3RD GRADE
99.6/ 100
METRIC RATING
65th/ 347
METRIC RANK
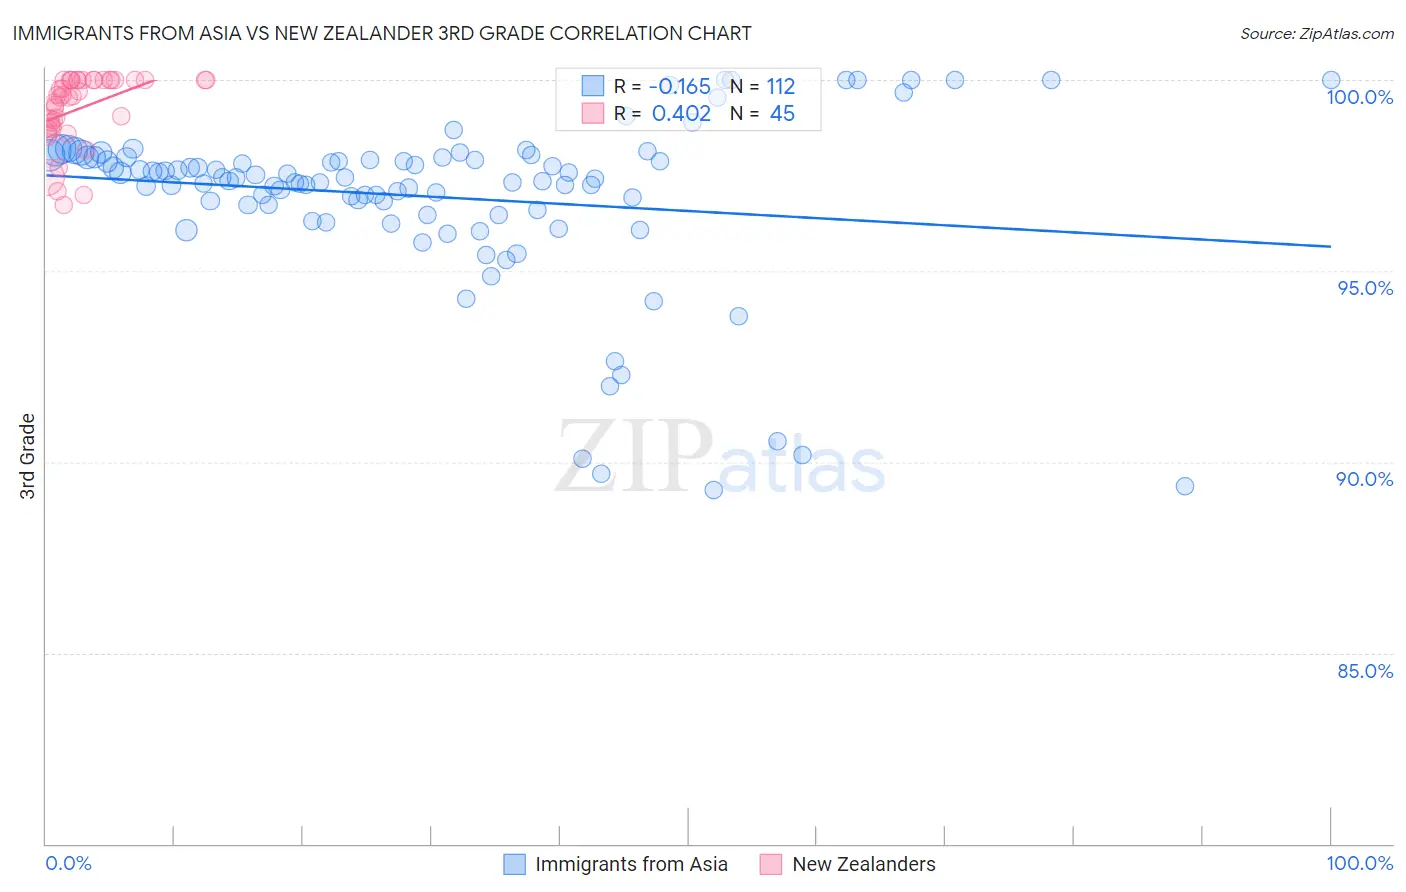
Immigrants from Asia vs New Zealander 3rd Grade Correlation Chart
The statistical analysis conducted on geographies consisting of 549,170,269 people shows a poor negative correlation between the proportion of Immigrants from Asia and percentage of population with at least 3rd grade education in the United States with a correlation coefficient (R) of -0.165 and weighted average of 97.4%. Similarly, the statistical analysis conducted on geographies consisting of 106,918,889 people shows a moderate positive correlation between the proportion of New Zealanders and percentage of population with at least 3rd grade education in the United States with a correlation coefficient (R) of 0.402 and weighted average of 98.2%, a difference of 0.88%.
3rd Grade Correlation Summary
| Measurement | Immigrants from Asia | New Zealander |
| Minimum | 89.3% | 96.7% |
| Maximum | 100.0% | 100.0% |
| Range | 10.7% | 3.3% |
| Mean | 96.9% | 99.3% |
| Median | 97.4% | 99.6% |
| Interquartile 25% (IQ1) | 96.7% | 98.8% |
| Interquartile 75% (IQ3) | 98.0% | 100.0% |
| Interquartile Range (IQR) | 1.3% | 1.2% |
| Standard Deviation (Sample) | 2.2% | 0.91% |
| Standard Deviation (Population) | 2.2% | 0.90% |
Similar Demographics by 3rd Grade
Demographics Similar to Immigrants from Asia by 3rd Grade
In terms of 3rd grade, the demographic groups most similar to Immigrants from Asia are Immigrants from Middle Africa (97.4%, a difference of 0.0%), Peruvian (97.4%, a difference of 0.0%), Immigrants from Africa (97.4%, a difference of 0.0%), Immigrants from Senegal (97.4%, a difference of 0.010%), and Assyrian/Chaldean/Syriac (97.4%, a difference of 0.010%).
| Demographics | Rating | Rank | 3rd Grade |
| Asians | 1.1 /100 | #244 | Tragic 97.4% |
| Ethiopians | 1.1 /100 | #245 | Tragic 97.4% |
| Immigrants | Senegal | 1.0 /100 | #246 | Tragic 97.4% |
| Assyrians/Chaldeans/Syriacs | 1.0 /100 | #247 | Tragic 97.4% |
| Immigrants | Eastern Africa | 0.9 /100 | #248 | Tragic 97.4% |
| South Americans | 0.9 /100 | #249 | Tragic 97.4% |
| Immigrants | Middle Africa | 0.9 /100 | #250 | Tragic 97.4% |
| Immigrants | Asia | 0.8 /100 | #251 | Tragic 97.4% |
| Peruvians | 0.8 /100 | #252 | Tragic 97.4% |
| Immigrants | Africa | 0.8 /100 | #253 | Tragic 97.4% |
| Jamaicans | 0.7 /100 | #254 | Tragic 97.4% |
| Bolivians | 0.6 /100 | #255 | Tragic 97.3% |
| Immigrants | Congo | 0.6 /100 | #256 | Tragic 97.3% |
| Immigrants | Colombia | 0.5 /100 | #257 | Tragic 97.3% |
| Immigrants | Liberia | 0.5 /100 | #258 | Tragic 97.3% |
Demographics Similar to New Zealanders by 3rd Grade
In terms of 3rd grade, the demographic groups most similar to New Zealanders are Kiowa (98.2%, a difference of 0.0%), Serbian (98.2%, a difference of 0.0%), Russian (98.2%, a difference of 0.0%), Immigrants from Northern Europe (98.2%, a difference of 0.0%), and Canadian (98.2%, a difference of 0.0%).
| Demographics | Rating | Rank | 3rd Grade |
| Greeks | 99.7 /100 | #58 | Exceptional 98.3% |
| Maltese | 99.7 /100 | #59 | Exceptional 98.3% |
| Creek | 99.7 /100 | #60 | Exceptional 98.2% |
| Pueblo | 99.7 /100 | #61 | Exceptional 98.2% |
| Immigrants | Canada | 99.7 /100 | #62 | Exceptional 98.2% |
| Immigrants | North America | 99.7 /100 | #63 | Exceptional 98.2% |
| Kiowa | 99.6 /100 | #64 | Exceptional 98.2% |
| New Zealanders | 99.6 /100 | #65 | Exceptional 98.2% |
| Serbians | 99.6 /100 | #66 | Exceptional 98.2% |
| Russians | 99.6 /100 | #67 | Exceptional 98.2% |
| Immigrants | Northern Europe | 99.6 /100 | #68 | Exceptional 98.2% |
| Canadians | 99.6 /100 | #69 | Exceptional 98.2% |
| Cajuns | 99.6 /100 | #70 | Exceptional 98.2% |
| Immigrants | Austria | 99.6 /100 | #71 | Exceptional 98.2% |
| Chickasaw | 99.5 /100 | #72 | Exceptional 98.2% |