Immigrants from Asia vs Immigrants from Western Africa Nursery School
COMPARE
Immigrants from Asia
Immigrants from Western Africa
Nursery School
Nursery School Comparison
Immigrants from Asia
Immigrants from Western Africa
97.6%
NURSERY SCHOOL
0.7/ 100
METRIC RATING
255th/ 347
METRIC RANK
97.4%
NURSERY SCHOOL
0.1/ 100
METRIC RATING
277th/ 347
METRIC RANK
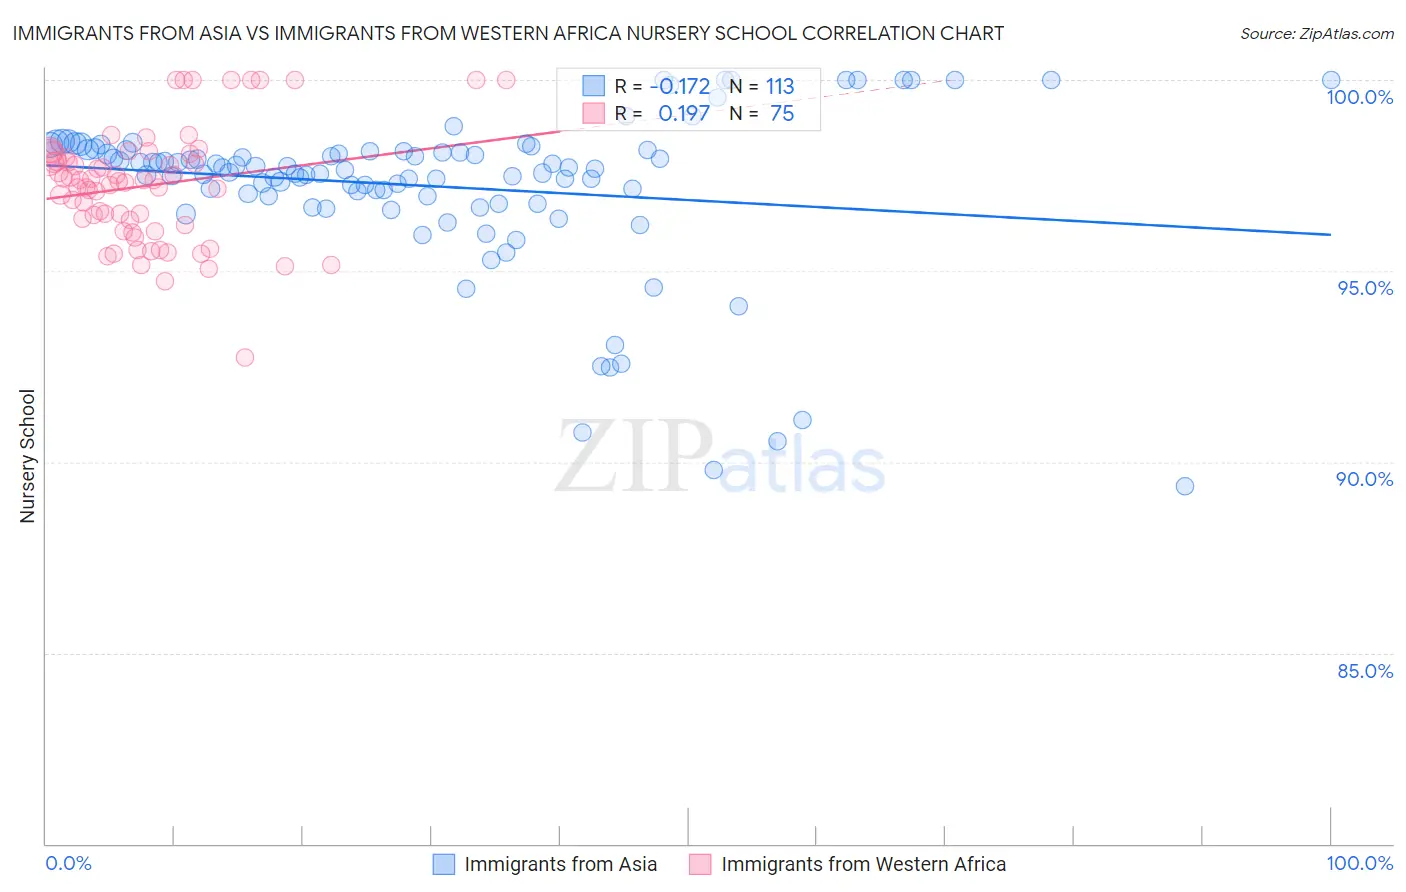
Immigrants from Asia vs Immigrants from Western Africa Nursery School Correlation Chart
The statistical analysis conducted on geographies consisting of 549,170,546 people shows a poor negative correlation between the proportion of Immigrants from Asia and percentage of population with at least nursery school education in the United States with a correlation coefficient (R) of -0.172 and weighted average of 97.6%. Similarly, the statistical analysis conducted on geographies consisting of 357,811,354 people shows a poor positive correlation between the proportion of Immigrants from Western Africa and percentage of population with at least nursery school education in the United States with a correlation coefficient (R) of 0.197 and weighted average of 97.4%, a difference of 0.17%.
Nursery School Correlation Summary
| Measurement | Immigrants from Asia | Immigrants from Western Africa |
| Minimum | 89.4% | 92.7% |
| Maximum | 100.0% | 100.0% |
| Range | 10.6% | 7.3% |
| Mean | 97.2% | 97.2% |
| Median | 97.7% | 97.4% |
| Interquartile 25% (IQ1) | 97.0% | 96.2% |
| Interquartile 75% (IQ3) | 98.2% | 98.0% |
| Interquartile Range (IQR) | 1.2% | 1.8% |
| Standard Deviation (Sample) | 2.1% | 1.5% |
| Standard Deviation (Population) | 2.1% | 1.5% |
Similar Demographics by Nursery School
Demographics Similar to Immigrants from Asia by Nursery School
In terms of nursery school, the demographic groups most similar to Immigrants from Asia are Immigrants from Congo (97.6%, a difference of 0.0%), Ethiopian (97.6%, a difference of 0.010%), Immigrants from Africa (97.6%, a difference of 0.010%), Immigrants from Iraq (97.6%, a difference of 0.010%), and Yaqui (97.6%, a difference of 0.010%).
| Demographics | Rating | Rank | Nursery School |
| Indians (Asian) | 0.9 /100 | #248 | Tragic 97.6% |
| Immigrants | Eastern Africa | 0.9 /100 | #249 | Tragic 97.6% |
| Immigrants | Senegal | 0.9 /100 | #250 | Tragic 97.6% |
| Ethiopians | 0.8 /100 | #251 | Tragic 97.6% |
| Immigrants | Africa | 0.8 /100 | #252 | Tragic 97.6% |
| Immigrants | Iraq | 0.7 /100 | #253 | Tragic 97.6% |
| Immigrants | Congo | 0.7 /100 | #254 | Tragic 97.6% |
| Immigrants | Asia | 0.7 /100 | #255 | Tragic 97.6% |
| Yaqui | 0.6 /100 | #256 | Tragic 97.6% |
| Immigrants | Colombia | 0.6 /100 | #257 | Tragic 97.6% |
| Jamaicans | 0.6 /100 | #258 | Tragic 97.6% |
| Armenians | 0.4 /100 | #259 | Tragic 97.6% |
| Immigrants | South America | 0.4 /100 | #260 | Tragic 97.6% |
| Cubans | 0.4 /100 | #261 | Tragic 97.6% |
| Immigrants | Ethiopia | 0.4 /100 | #262 | Tragic 97.6% |
Demographics Similar to Immigrants from Western Africa by Nursery School
In terms of nursery school, the demographic groups most similar to Immigrants from Western Africa are Immigrants from Philippines (97.5%, a difference of 0.010%), Immigrants from Uzbekistan (97.4%, a difference of 0.010%), Immigrants from Ghana (97.4%, a difference of 0.020%), Barbadian (97.4%, a difference of 0.020%), and Trinidadian and Tobagonian (97.4%, a difference of 0.020%).
| Demographics | Rating | Rank | Nursery School |
| Immigrants | Jamaica | 0.2 /100 | #270 | Tragic 97.5% |
| Immigrants | Peru | 0.2 /100 | #271 | Tragic 97.5% |
| Immigrants | Bolivia | 0.1 /100 | #272 | Tragic 97.5% |
| Immigrants | China | 0.1 /100 | #273 | Tragic 97.5% |
| Immigrants | Cameroon | 0.1 /100 | #274 | Tragic 97.5% |
| Ghanaians | 0.1 /100 | #275 | Tragic 97.5% |
| Immigrants | Philippines | 0.1 /100 | #276 | Tragic 97.5% |
| Immigrants | Western Africa | 0.1 /100 | #277 | Tragic 97.4% |
| Immigrants | Uzbekistan | 0.1 /100 | #278 | Tragic 97.4% |
| Immigrants | Ghana | 0.1 /100 | #279 | Tragic 97.4% |
| Barbadians | 0.0 /100 | #280 | Tragic 97.4% |
| Trinidadians and Tobagonians | 0.0 /100 | #281 | Tragic 97.4% |
| Afghans | 0.0 /100 | #282 | Tragic 97.4% |
| Immigrants | West Indies | 0.0 /100 | #283 | Tragic 97.4% |
| Immigrants | Trinidad and Tobago | 0.0 /100 | #284 | Tragic 97.4% |