Immigrants from Asia vs Guamanian/Chamorro 12th Grade, No Diploma
COMPARE
Immigrants from Asia
Guamanian/Chamorro
12th Grade, No Diploma
12th Grade, No Diploma Comparison
Immigrants from Asia
Guamanians/Chamorros
91.3%
12TH GRADE, NO DIPLOMA
61.5/ 100
METRIC RATING
163rd/ 347
METRIC RANK
91.0%
12TH GRADE, NO DIPLOMA
39.5/ 100
METRIC RATING
181st/ 347
METRIC RANK
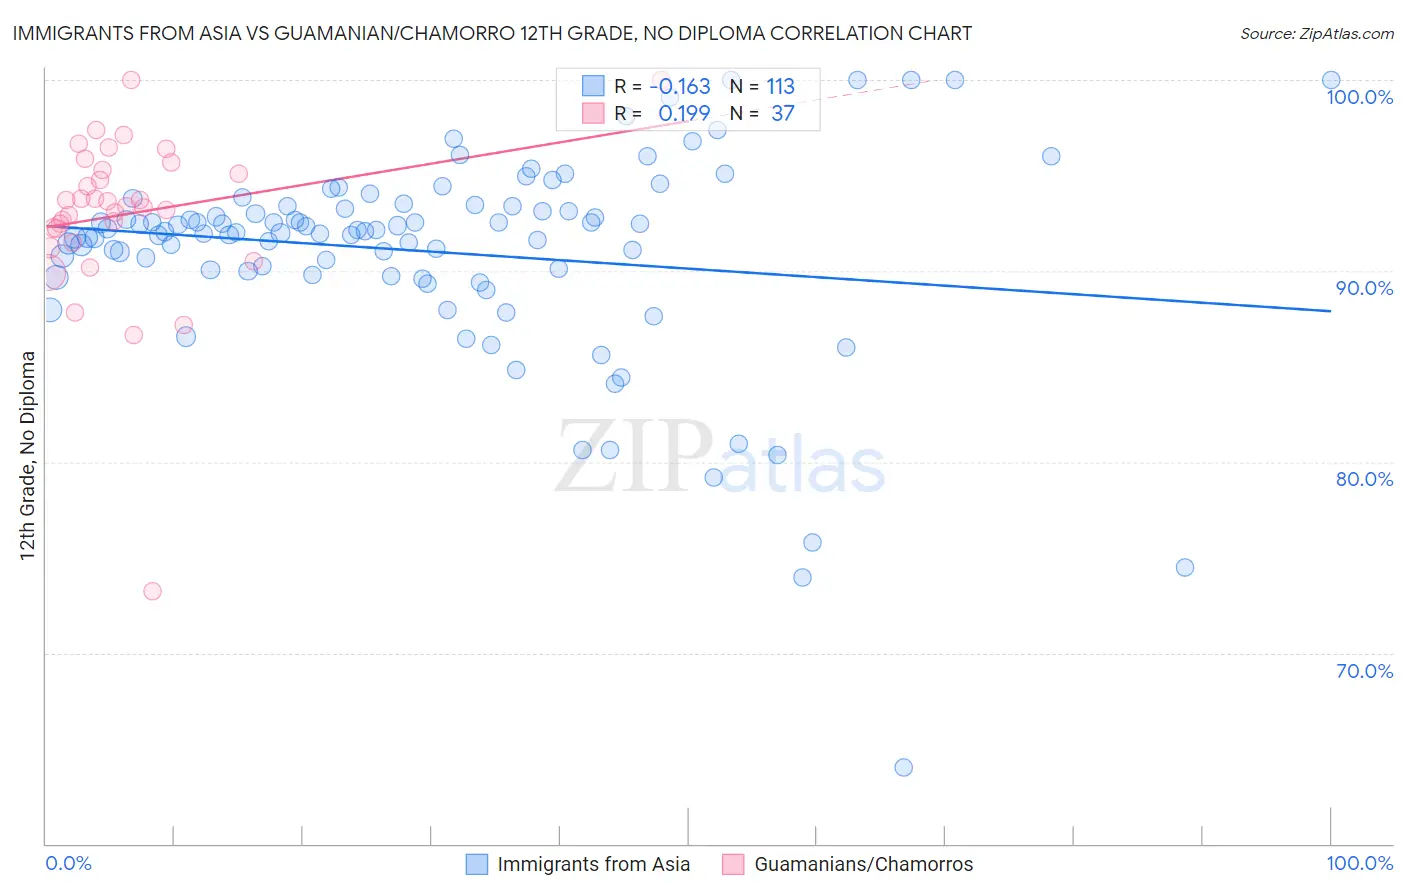
Immigrants from Asia vs Guamanian/Chamorro 12th Grade, No Diploma Correlation Chart
The statistical analysis conducted on geographies consisting of 549,170,397 people shows a poor negative correlation between the proportion of Immigrants from Asia and percentage of population with at least 12th grade (no diploma) education in the United States with a correlation coefficient (R) of -0.163 and weighted average of 91.3%. Similarly, the statistical analysis conducted on geographies consisting of 221,965,618 people shows a poor positive correlation between the proportion of Guamanians/Chamorros and percentage of population with at least 12th grade (no diploma) education in the United States with a correlation coefficient (R) of 0.199 and weighted average of 91.0%, a difference of 0.28%.
12th Grade, No Diploma Correlation Summary
| Measurement | Immigrants from Asia | Guamanian/Chamorro |
| Minimum | 64.0% | 73.2% |
| Maximum | 100.0% | 100.0% |
| Range | 36.0% | 26.8% |
| Mean | 91.0% | 93.0% |
| Median | 92.1% | 93.4% |
| Interquartile 25% (IQ1) | 89.9% | 91.9% |
| Interquartile 75% (IQ3) | 93.4% | 95.5% |
| Interquartile Range (IQR) | 3.5% | 3.6% |
| Standard Deviation (Sample) | 5.5% | 4.5% |
| Standard Deviation (Population) | 5.5% | 4.4% |
Demographics Similar to Immigrants from Asia and Guamanians/Chamorros by 12th Grade, No Diploma
In terms of 12th grade, no diploma, the demographic groups most similar to Immigrants from Asia are Brazilian (91.3%, a difference of 0.010%), Immigrants from China (91.3%, a difference of 0.010%), Alsatian (91.3%, a difference of 0.040%), Hmong (91.3%, a difference of 0.040%), and Immigrants from Malaysia (91.3%, a difference of 0.050%). Similarly, the demographic groups most similar to Guamanians/Chamorros are Immigrants from Syria (91.1%, a difference of 0.010%), Nonimmigrants (91.0%, a difference of 0.010%), Spanish (91.1%, a difference of 0.050%), Immigrants from Chile (91.1%, a difference of 0.050%), and Sierra Leonean (91.1%, a difference of 0.10%).
| Demographics | Rating | Rank | 12th Grade, No Diploma |
| Brazilians | 62.0 /100 | #162 | Good 91.3% |
| Immigrants | Asia | 61.5 /100 | #163 | Good 91.3% |
| Immigrants | China | 60.9 /100 | #164 | Good 91.3% |
| Alsatians | 58.3 /100 | #165 | Average 91.3% |
| Hmong | 58.0 /100 | #166 | Average 91.3% |
| Immigrants | Malaysia | 57.8 /100 | #167 | Average 91.3% |
| Cree | 57.0 /100 | #168 | Average 91.2% |
| Immigrants | Indonesia | 54.9 /100 | #169 | Average 91.2% |
| Delaware | 52.8 /100 | #170 | Average 91.2% |
| Immigrants | Morocco | 51.4 /100 | #171 | Average 91.2% |
| Bermudans | 50.8 /100 | #172 | Average 91.2% |
| Bolivians | 50.4 /100 | #173 | Average 91.2% |
| Immigrants | Nepal | 50.0 /100 | #174 | Average 91.2% |
| Immigrants | Western Asia | 49.0 /100 | #175 | Average 91.2% |
| Iroquois | 48.5 /100 | #176 | Average 91.1% |
| Sierra Leoneans | 47.7 /100 | #177 | Average 91.1% |
| Spanish | 43.7 /100 | #178 | Average 91.1% |
| Immigrants | Chile | 43.3 /100 | #179 | Average 91.1% |
| Immigrants | Syria | 40.3 /100 | #180 | Average 91.1% |
| Guamanians/Chamorros | 39.5 /100 | #181 | Fair 91.0% |
| Immigrants | Nonimmigrants | 38.8 /100 | #182 | Fair 91.0% |