Immigrants from Asia vs Ghanaian 6th Grade
COMPARE
Immigrants from Asia
Ghanaian
6th Grade
6th Grade Comparison
Immigrants from Asia
Ghanaians
96.6%
6TH GRADE
1.8/ 100
METRIC RATING
242nd/ 347
METRIC RANK
96.4%
6TH GRADE
0.2/ 100
METRIC RATING
266th/ 347
METRIC RANK
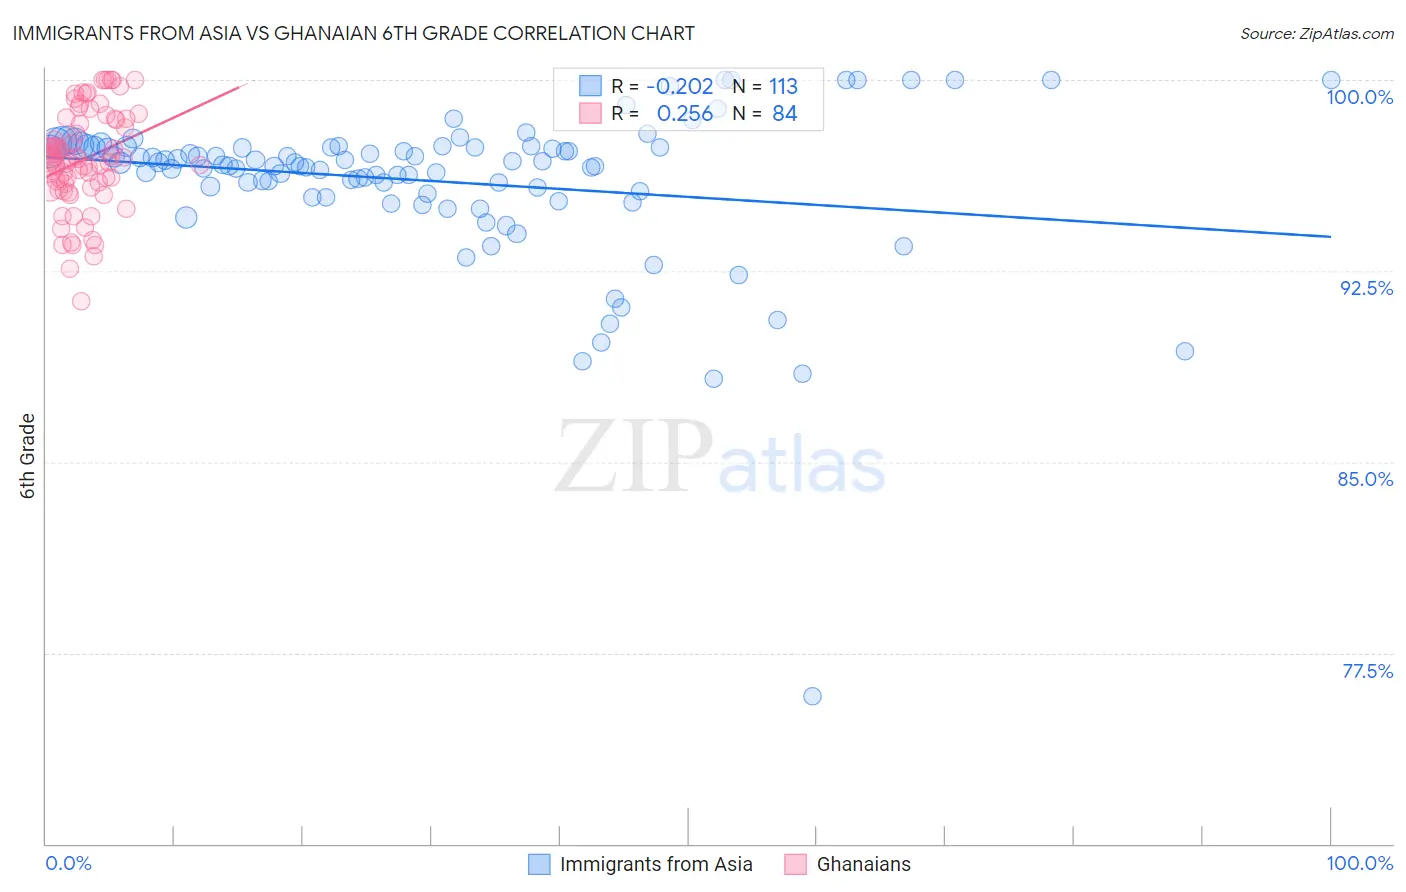
Immigrants from Asia vs Ghanaian 6th Grade Correlation Chart
The statistical analysis conducted on geographies consisting of 549,170,438 people shows a weak negative correlation between the proportion of Immigrants from Asia and percentage of population with at least 6th grade education in the United States with a correlation coefficient (R) of -0.202 and weighted average of 96.6%. Similarly, the statistical analysis conducted on geographies consisting of 190,712,873 people shows a weak positive correlation between the proportion of Ghanaians and percentage of population with at least 6th grade education in the United States with a correlation coefficient (R) of 0.256 and weighted average of 96.4%, a difference of 0.24%.
6th Grade Correlation Summary
| Measurement | Immigrants from Asia | Ghanaian |
| Minimum | 75.8% | 91.3% |
| Maximum | 100.0% | 100.0% |
| Range | 24.2% | 8.7% |
| Mean | 96.0% | 96.9% |
| Median | 96.8% | 96.9% |
| Interquartile 25% (IQ1) | 95.6% | 95.8% |
| Interquartile 75% (IQ3) | 97.4% | 98.4% |
| Interquartile Range (IQR) | 1.8% | 2.6% |
| Standard Deviation (Sample) | 3.1% | 1.9% |
| Standard Deviation (Population) | 3.1% | 1.9% |
Similar Demographics by 6th Grade
Demographics Similar to Immigrants from Asia by 6th Grade
In terms of 6th grade, the demographic groups most similar to Immigrants from Asia are Senegalese (96.6%, a difference of 0.0%), Nigerian (96.6%, a difference of 0.010%), Indian (Asian) (96.6%, a difference of 0.010%), Korean (96.6%, a difference of 0.010%), and Immigrants from Liberia (96.6%, a difference of 0.010%).
| Demographics | Rating | Rank | 6th Grade |
| Asians | 2.4 /100 | #235 | Tragic 96.6% |
| Immigrants | Indonesia | 2.3 /100 | #236 | Tragic 96.6% |
| Immigrants | Eastern Africa | 2.0 /100 | #237 | Tragic 96.6% |
| Nigerians | 1.9 /100 | #238 | Tragic 96.6% |
| Indians (Asian) | 1.9 /100 | #239 | Tragic 96.6% |
| Koreans | 1.9 /100 | #240 | Tragic 96.6% |
| Senegalese | 1.8 /100 | #241 | Tragic 96.6% |
| Immigrants | Asia | 1.8 /100 | #242 | Tragic 96.6% |
| Immigrants | Liberia | 1.6 /100 | #243 | Tragic 96.6% |
| Ethiopians | 1.5 /100 | #244 | Tragic 96.6% |
| Immigrants | Costa Rica | 1.3 /100 | #245 | Tragic 96.6% |
| Immigrants | Africa | 1.3 /100 | #246 | Tragic 96.6% |
| Bolivians | 1.0 /100 | #247 | Tragic 96.5% |
| Tohono O'odham | 1.0 /100 | #248 | Tragic 96.5% |
| Colombians | 0.9 /100 | #249 | Tragic 96.5% |
Demographics Similar to Ghanaians by 6th Grade
In terms of 6th grade, the demographic groups most similar to Ghanaians are Afghan (96.4%, a difference of 0.0%), Immigrants from Jamaica (96.4%, a difference of 0.010%), Immigrants from Colombia (96.4%, a difference of 0.020%), Armenian (96.4%, a difference of 0.020%), and Immigrants from Nigeria (96.4%, a difference of 0.030%).
| Demographics | Rating | Rank | 6th Grade |
| South Americans | 0.4 /100 | #259 | Tragic 96.4% |
| Peruvians | 0.4 /100 | #260 | Tragic 96.4% |
| Immigrants | Sierra Leone | 0.4 /100 | #261 | Tragic 96.4% |
| Immigrants | Nigeria | 0.3 /100 | #262 | Tragic 96.4% |
| Immigrants | Colombia | 0.3 /100 | #263 | Tragic 96.4% |
| Armenians | 0.3 /100 | #264 | Tragic 96.4% |
| Immigrants | Jamaica | 0.2 /100 | #265 | Tragic 96.4% |
| Ghanaians | 0.2 /100 | #266 | Tragic 96.4% |
| Afghans | 0.2 /100 | #267 | Tragic 96.4% |
| Immigrants | Uzbekistan | 0.2 /100 | #268 | Tragic 96.3% |
| West Indians | 0.2 /100 | #269 | Tragic 96.3% |
| Immigrants | South America | 0.2 /100 | #270 | Tragic 96.3% |
| Immigrants | Hong Kong | 0.2 /100 | #271 | Tragic 96.3% |
| Immigrants | Bolivia | 0.1 /100 | #272 | Tragic 96.3% |
| Immigrants | Cameroon | 0.1 /100 | #273 | Tragic 96.3% |