Immigrants from Asia vs Alaskan Athabascan Master's Degree
COMPARE
Immigrants from Asia
Alaskan Athabascan
Master's Degree
Master's Degree Comparison
Immigrants from Asia
Alaskan Athabascans
18.4%
MASTER'S DEGREE
99.9/ 100
METRIC RATING
57th/ 347
METRIC RANK
11.6%
MASTER'S DEGREE
0.1/ 100
METRIC RATING
296th/ 347
METRIC RANK
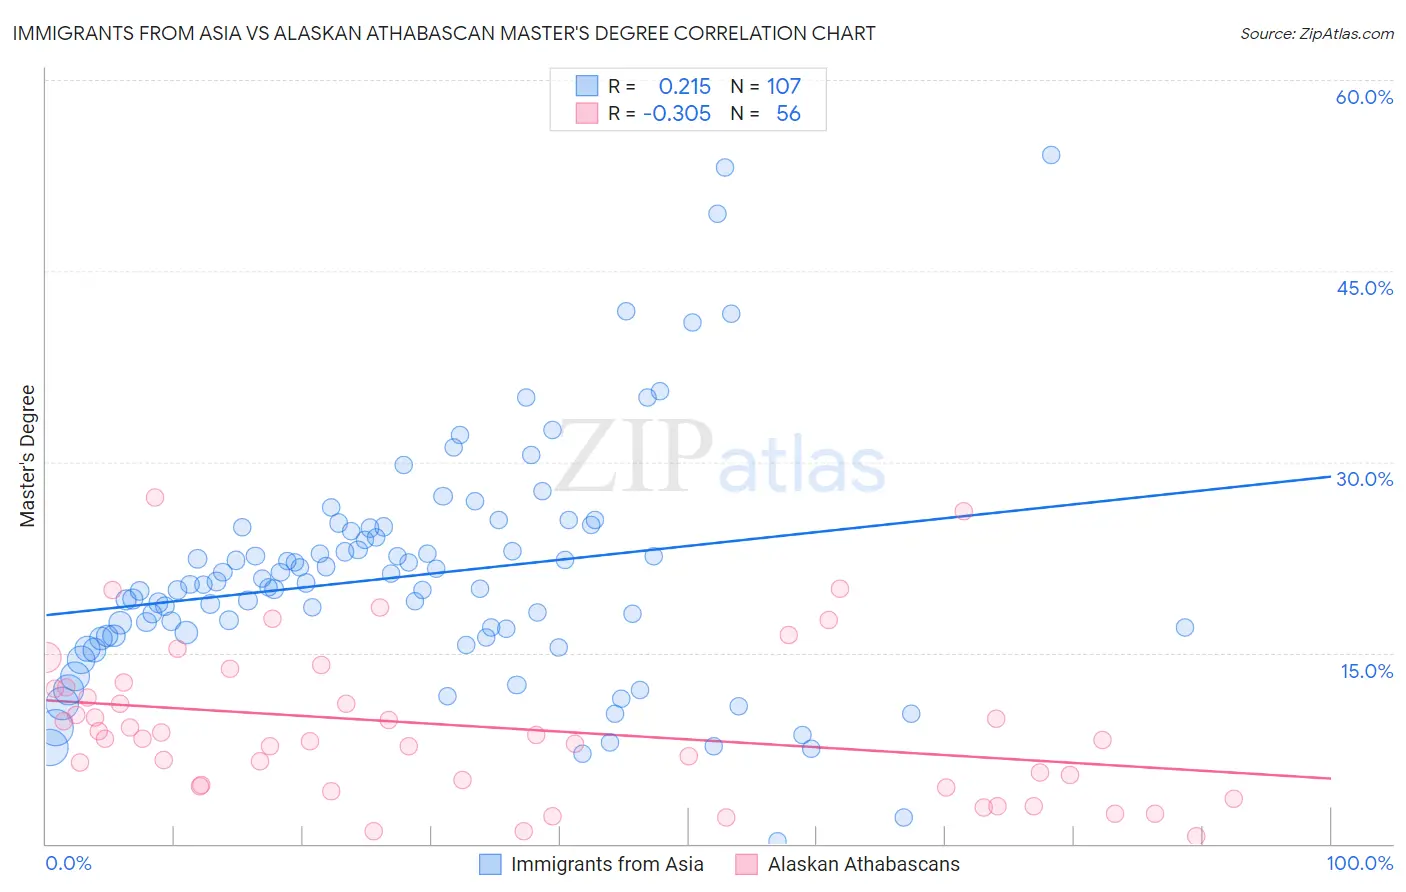
Immigrants from Asia vs Alaskan Athabascan Master's Degree Correlation Chart
The statistical analysis conducted on geographies consisting of 548,687,564 people shows a weak positive correlation between the proportion of Immigrants from Asia and percentage of population with at least master's degree education in the United States with a correlation coefficient (R) of 0.215 and weighted average of 18.4%. Similarly, the statistical analysis conducted on geographies consisting of 45,807,187 people shows a mild negative correlation between the proportion of Alaskan Athabascans and percentage of population with at least master's degree education in the United States with a correlation coefficient (R) of -0.305 and weighted average of 11.6%, a difference of 59.2%.
Master's Degree Correlation Summary
| Measurement | Immigrants from Asia | Alaskan Athabascan |
| Minimum | 0.15% | 0.59% |
| Maximum | 54.1% | 27.2% |
| Range | 54.0% | 26.6% |
| Mean | 21.0% | 9.2% |
| Median | 20.3% | 8.2% |
| Interquartile 25% (IQ1) | 16.3% | 4.6% |
| Interquartile 75% (IQ3) | 24.5% | 12.2% |
| Interquartile Range (IQR) | 8.2% | 7.6% |
| Standard Deviation (Sample) | 9.2% | 6.0% |
| Standard Deviation (Population) | 9.2% | 6.0% |
Similar Demographics by Master's Degree
Demographics Similar to Immigrants from Asia by Master's Degree
In terms of master's degree, the demographic groups most similar to Immigrants from Asia are Australian (18.4%, a difference of 0.13%), Asian (18.4%, a difference of 0.14%), Immigrants from Serbia (18.5%, a difference of 0.36%), Immigrants from Lithuania (18.5%, a difference of 0.39%), and Immigrants from Bulgaria (18.3%, a difference of 0.57%).
| Demographics | Rating | Rank | Master's Degree |
| Bulgarians | 100.0 /100 | #50 | Exceptional 18.8% |
| Immigrants | South Africa | 100.0 /100 | #51 | Exceptional 18.8% |
| Immigrants | Kuwait | 100.0 /100 | #52 | Exceptional 18.6% |
| Immigrants | Czechoslovakia | 99.9 /100 | #53 | Exceptional 18.5% |
| Immigrants | Lithuania | 99.9 /100 | #54 | Exceptional 18.5% |
| Immigrants | Serbia | 99.9 /100 | #55 | Exceptional 18.5% |
| Asians | 99.9 /100 | #56 | Exceptional 18.4% |
| Immigrants | Asia | 99.9 /100 | #57 | Exceptional 18.4% |
| Australians | 99.9 /100 | #58 | Exceptional 18.4% |
| Immigrants | Bulgaria | 99.9 /100 | #59 | Exceptional 18.3% |
| New Zealanders | 99.9 /100 | #60 | Exceptional 18.3% |
| Immigrants | Europe | 99.9 /100 | #61 | Exceptional 18.2% |
| Argentineans | 99.9 /100 | #62 | Exceptional 18.2% |
| Immigrants | Netherlands | 99.9 /100 | #63 | Exceptional 18.1% |
| South Africans | 99.9 /100 | #64 | Exceptional 18.1% |
Demographics Similar to Alaskan Athabascans by Master's Degree
In terms of master's degree, the demographic groups most similar to Alaskan Athabascans are Marshallese (11.6%, a difference of 0.010%), Immigrants from Yemen (11.6%, a difference of 0.12%), Hawaiian (11.6%, a difference of 0.16%), Alaska Native (11.6%, a difference of 0.26%), and Immigrants from Guatemala (11.6%, a difference of 0.48%).
| Demographics | Rating | Rank | Master's Degree |
| Guatemalans | 0.1 /100 | #289 | Tragic 11.7% |
| Ute | 0.1 /100 | #290 | Tragic 11.7% |
| Colville | 0.1 /100 | #291 | Tragic 11.6% |
| Immigrants | Guatemala | 0.1 /100 | #292 | Tragic 11.6% |
| Alaska Natives | 0.1 /100 | #293 | Tragic 11.6% |
| Hawaiians | 0.1 /100 | #294 | Tragic 11.6% |
| Marshallese | 0.1 /100 | #295 | Tragic 11.6% |
| Alaskan Athabascans | 0.1 /100 | #296 | Tragic 11.6% |
| Immigrants | Yemen | 0.1 /100 | #297 | Tragic 11.6% |
| Samoans | 0.1 /100 | #298 | Tragic 11.5% |
| Chickasaw | 0.1 /100 | #299 | Tragic 11.4% |
| Chippewa | 0.1 /100 | #300 | Tragic 11.4% |
| Tsimshian | 0.1 /100 | #301 | Tragic 11.4% |
| Cherokee | 0.1 /100 | #302 | Tragic 11.4% |
| Immigrants | Laos | 0.1 /100 | #303 | Tragic 11.4% |