Immigrants from Armenia vs Sioux Associate's Degree
COMPARE
Immigrants from Armenia
Sioux
Associate's Degree
Associate's Degree Comparison
Immigrants from Armenia
Sioux
47.4%
ASSOCIATE'S DEGREE
76.6/ 100
METRIC RATING
149th/ 347
METRIC RANK
38.5%
ASSOCIATE'S DEGREE
0.0/ 100
METRIC RATING
304th/ 347
METRIC RANK
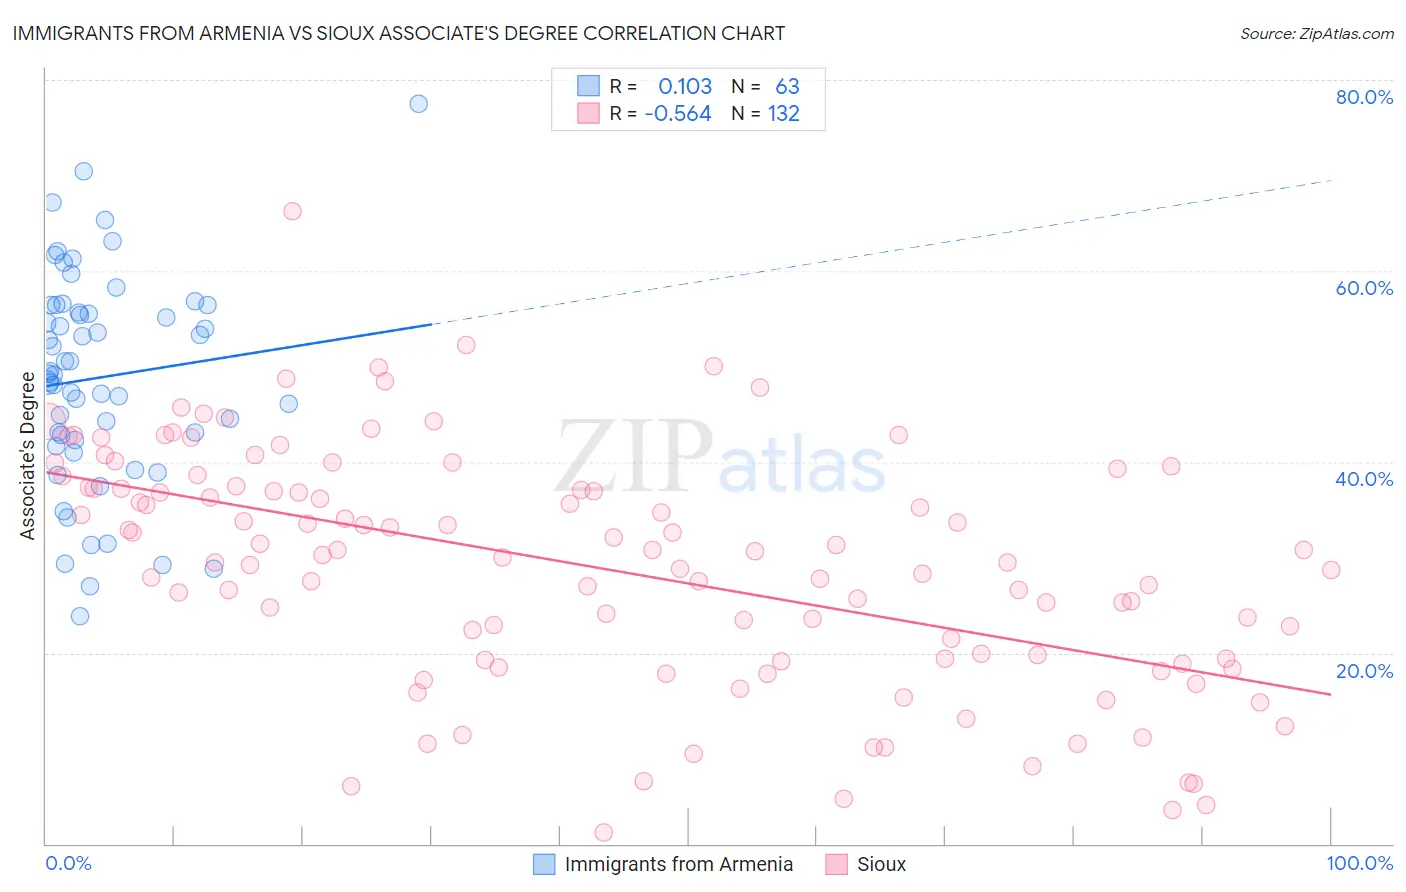
Immigrants from Armenia vs Sioux Associate's Degree Correlation Chart
The statistical analysis conducted on geographies consisting of 97,722,982 people shows a poor positive correlation between the proportion of Immigrants from Armenia and percentage of population with at least associate's degree education in the United States with a correlation coefficient (R) of 0.103 and weighted average of 47.4%. Similarly, the statistical analysis conducted on geographies consisting of 234,195,358 people shows a substantial negative correlation between the proportion of Sioux and percentage of population with at least associate's degree education in the United States with a correlation coefficient (R) of -0.564 and weighted average of 38.5%, a difference of 23.2%.
Associate's Degree Correlation Summary
| Measurement | Immigrants from Armenia | Sioux |
| Minimum | 23.8% | 1.2% |
| Maximum | 77.6% | 66.3% |
| Range | 53.7% | 65.1% |
| Mean | 48.9% | 28.9% |
| Median | 49.2% | 30.1% |
| Interquartile 25% (IQ1) | 42.3% | 19.3% |
| Interquartile 75% (IQ3) | 56.4% | 37.3% |
| Interquartile Range (IQR) | 14.1% | 18.0% |
| Standard Deviation (Sample) | 11.1% | 12.4% |
| Standard Deviation (Population) | 11.0% | 12.3% |
Similar Demographics by Associate's Degree
Demographics Similar to Immigrants from Armenia by Associate's Degree
In terms of associate's degree, the demographic groups most similar to Immigrants from Armenia are South American Indian (47.4%, a difference of 0.010%), Iraqi (47.4%, a difference of 0.040%), Immigrants from North Macedonia (47.4%, a difference of 0.060%), Danish (47.4%, a difference of 0.070%), and Immigrants from Sudan (47.4%, a difference of 0.13%).
| Demographics | Rating | Rank | Associate's Degree |
| Sierra Leoneans | 82.9 /100 | #142 | Excellent 47.7% |
| Norwegians | 81.0 /100 | #143 | Excellent 47.6% |
| Slavs | 80.5 /100 | #144 | Excellent 47.6% |
| Canadians | 79.0 /100 | #145 | Good 47.5% |
| Immigrants | Sudan | 77.9 /100 | #146 | Good 47.4% |
| Danes | 77.3 /100 | #147 | Good 47.4% |
| South American Indians | 76.7 /100 | #148 | Good 47.4% |
| Immigrants | Armenia | 76.6 /100 | #149 | Good 47.4% |
| Iraqis | 76.2 /100 | #150 | Good 47.4% |
| Immigrants | North Macedonia | 76.0 /100 | #151 | Good 47.4% |
| Immigrants | Afghanistan | 74.3 /100 | #152 | Good 47.3% |
| Czechs | 72.2 /100 | #153 | Good 47.2% |
| Immigrants | Kenya | 72.1 /100 | #154 | Good 47.2% |
| Kenyans | 70.6 /100 | #155 | Good 47.1% |
| South Americans | 70.5 /100 | #156 | Good 47.1% |
Demographics Similar to Sioux by Associate's Degree
In terms of associate's degree, the demographic groups most similar to Sioux are Guatemalan (38.5%, a difference of 0.050%), Immigrants from Honduras (38.5%, a difference of 0.070%), Shoshone (38.4%, a difference of 0.13%), Colville (38.5%, a difference of 0.14%), and Immigrants from El Salvador (38.4%, a difference of 0.17%).
| Demographics | Rating | Rank | Associate's Degree |
| Cape Verdeans | 0.0 /100 | #297 | Tragic 38.8% |
| Cheyenne | 0.0 /100 | #298 | Tragic 38.7% |
| Ute | 0.0 /100 | #299 | Tragic 38.6% |
| Chickasaw | 0.0 /100 | #300 | Tragic 38.6% |
| Tsimshian | 0.0 /100 | #301 | Tragic 38.6% |
| Colville | 0.0 /100 | #302 | Tragic 38.5% |
| Guatemalans | 0.0 /100 | #303 | Tragic 38.5% |
| Sioux | 0.0 /100 | #304 | Tragic 38.5% |
| Immigrants | Honduras | 0.0 /100 | #305 | Tragic 38.5% |
| Shoshone | 0.0 /100 | #306 | Tragic 38.4% |
| Immigrants | El Salvador | 0.0 /100 | #307 | Tragic 38.4% |
| Mexican American Indians | 0.0 /100 | #308 | Tragic 38.2% |
| Immigrants | Guatemala | 0.0 /100 | #309 | Tragic 38.1% |
| Immigrants | Dominican Republic | 0.0 /100 | #310 | Tragic 37.9% |
| Immigrants | Latin America | 0.0 /100 | #311 | Tragic 37.9% |