Immigrants from Armenia vs Scottish Doctorate Degree
COMPARE
Immigrants from Armenia
Scottish
Doctorate Degree
Doctorate Degree Comparison
Immigrants from Armenia
Scottish
1.7%
DOCTORATE DEGREE
15.1/ 100
METRIC RATING
211th/ 347
METRIC RANK
2.0%
DOCTORATE DEGREE
89.4/ 100
METRIC RATING
132nd/ 347
METRIC RANK
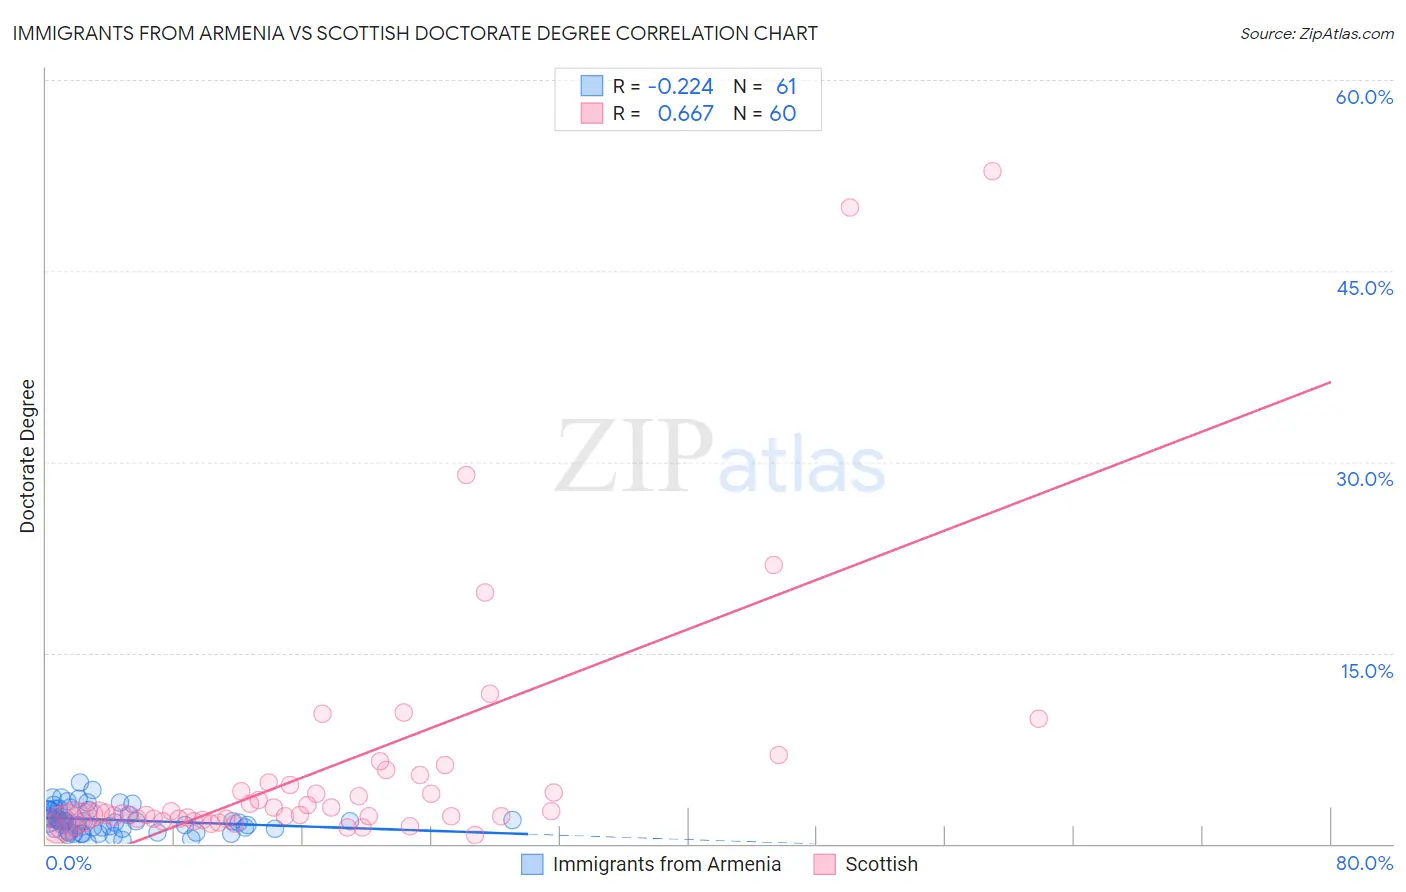
Immigrants from Armenia vs Scottish Doctorate Degree Correlation Chart
The statistical analysis conducted on geographies consisting of 97,532,084 people shows a weak negative correlation between the proportion of Immigrants from Armenia and percentage of population with at least doctorate degree education in the United States with a correlation coefficient (R) of -0.224 and weighted average of 1.7%. Similarly, the statistical analysis conducted on geographies consisting of 542,697,657 people shows a significant positive correlation between the proportion of Scottish and percentage of population with at least doctorate degree education in the United States with a correlation coefficient (R) of 0.667 and weighted average of 2.0%, a difference of 15.1%.
Doctorate Degree Correlation Summary
| Measurement | Immigrants from Armenia | Scottish |
| Minimum | 0.12% | 0.73% |
| Maximum | 4.8% | 52.8% |
| Range | 4.7% | 52.1% |
| Mean | 1.9% | 5.9% |
| Median | 1.7% | 2.4% |
| Interquartile 25% (IQ1) | 1.2% | 2.0% |
| Interquartile 75% (IQ3) | 2.7% | 4.7% |
| Interquartile Range (IQR) | 1.5% | 2.7% |
| Standard Deviation (Sample) | 1.0% | 9.9% |
| Standard Deviation (Population) | 1.0% | 9.9% |
Similar Demographics by Doctorate Degree
Demographics Similar to Immigrants from Armenia by Doctorate Degree
In terms of doctorate degree, the demographic groups most similar to Immigrants from Armenia are Tongan (1.7%, a difference of 0.010%), Immigrants from Western Africa (1.7%, a difference of 0.10%), Immigrants from South Eastern Asia (1.7%, a difference of 0.13%), Korean (1.7%, a difference of 0.27%), and Pueblo (1.7%, a difference of 0.28%).
| Demographics | Rating | Rank | Doctorate Degree |
| Somalis | 21.2 /100 | #204 | Fair 1.7% |
| Venezuelans | 19.5 /100 | #205 | Poor 1.7% |
| Immigrants | Peru | 17.6 /100 | #206 | Poor 1.7% |
| Yugoslavians | 17.1 /100 | #207 | Poor 1.7% |
| Colombians | 16.1 /100 | #208 | Poor 1.7% |
| Immigrants | Western Africa | 15.4 /100 | #209 | Poor 1.7% |
| Tongans | 15.1 /100 | #210 | Poor 1.7% |
| Immigrants | Armenia | 15.1 /100 | #211 | Poor 1.7% |
| Immigrants | South Eastern Asia | 14.7 /100 | #212 | Poor 1.7% |
| Koreans | 14.2 /100 | #213 | Poor 1.7% |
| Pueblo | 14.2 /100 | #214 | Poor 1.7% |
| Alaskan Athabascans | 13.8 /100 | #215 | Poor 1.7% |
| Immigrants | Burma/Myanmar | 13.5 /100 | #216 | Poor 1.7% |
| Spanish Americans | 12.9 /100 | #217 | Poor 1.7% |
| Tlingit-Haida | 11.9 /100 | #218 | Poor 1.7% |
Demographics Similar to Scottish by Doctorate Degree
In terms of doctorate degree, the demographic groups most similar to Scottish are Immigrants from Uzbekistan (2.0%, a difference of 0.050%), Immigrants from Cameroon (2.0%, a difference of 0.20%), Serbian (2.0%, a difference of 0.26%), Immigrants from Sierra Leone (2.0%, a difference of 0.28%), and Immigrants from Ukraine (2.0%, a difference of 0.41%).
| Demographics | Rating | Rank | Doctorate Degree |
| Moroccans | 93.0 /100 | #125 | Exceptional 2.0% |
| Jordanians | 92.1 /100 | #126 | Exceptional 2.0% |
| Palestinians | 92.0 /100 | #127 | Exceptional 2.0% |
| Immigrants | Zaire | 91.1 /100 | #128 | Exceptional 2.0% |
| Canadians | 90.6 /100 | #129 | Exceptional 2.0% |
| Immigrants | Ukraine | 90.5 /100 | #130 | Exceptional 2.0% |
| Immigrants | Sierra Leone | 90.2 /100 | #131 | Exceptional 2.0% |
| Scottish | 89.4 /100 | #132 | Excellent 2.0% |
| Immigrants | Uzbekistan | 89.3 /100 | #133 | Excellent 2.0% |
| Immigrants | Cameroon | 88.9 /100 | #134 | Excellent 2.0% |
| Serbians | 88.7 /100 | #135 | Excellent 2.0% |
| Swedes | 88.3 /100 | #136 | Excellent 2.0% |
| South American Indians | 88.3 /100 | #137 | Excellent 2.0% |
| Swiss | 88.0 /100 | #138 | Excellent 2.0% |
| Afghans | 87.2 /100 | #139 | Excellent 2.0% |