Immigrants from Armenia vs Immigrants from Spain Bachelor's Degree
COMPARE
Immigrants from Armenia
Immigrants from Spain
Bachelor's Degree
Bachelor's Degree Comparison
Immigrants from Armenia
Immigrants from Spain
39.4%
BACHELOR'S DEGREE
84.1/ 100
METRIC RATING
140th/ 347
METRIC RANK
44.3%
BACHELOR'S DEGREE
99.9/ 100
METRIC RATING
52nd/ 347
METRIC RANK
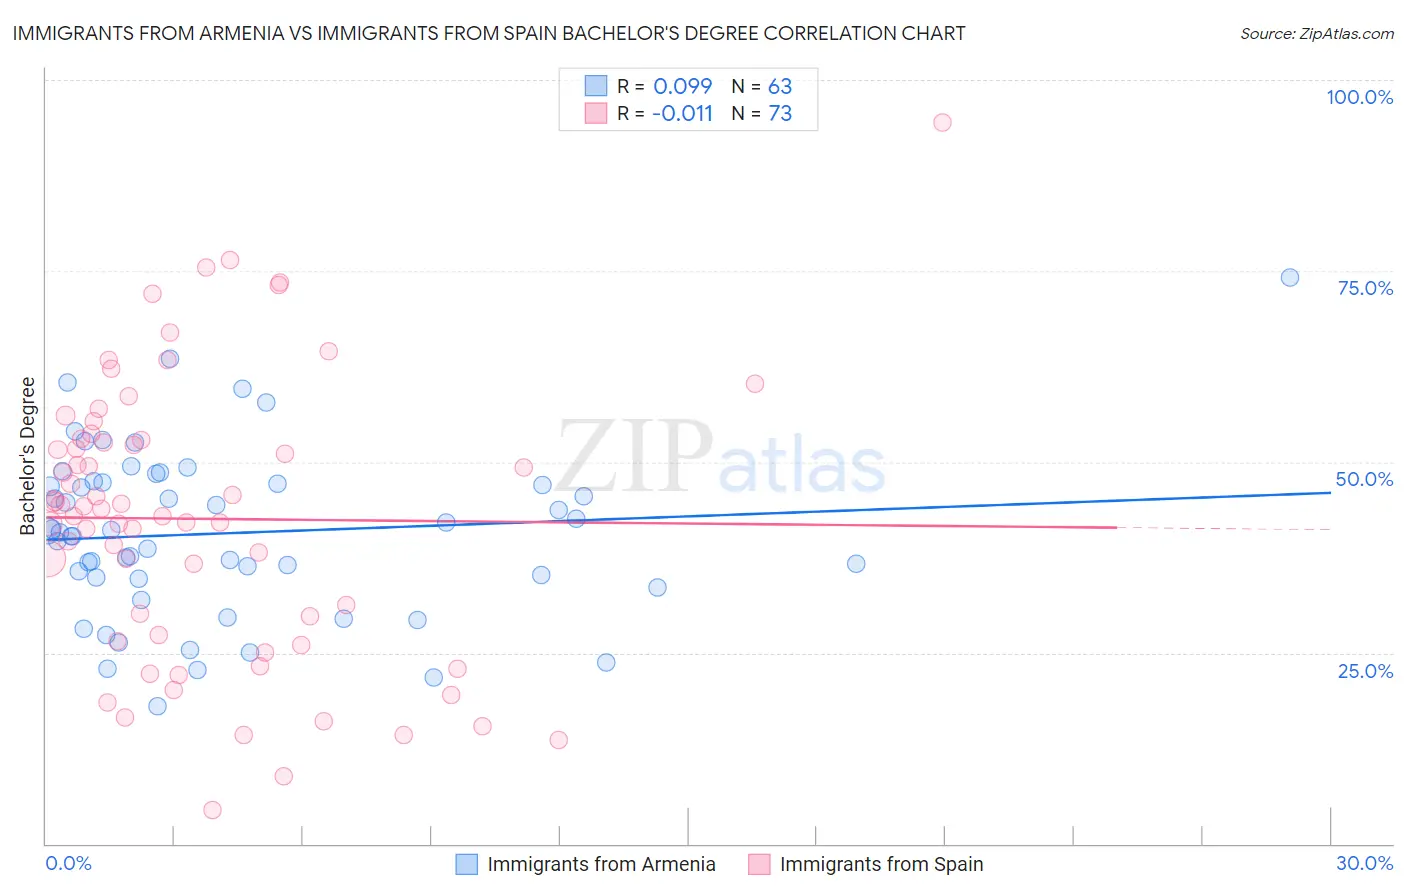
Immigrants from Armenia vs Immigrants from Spain Bachelor's Degree Correlation Chart
The statistical analysis conducted on geographies consisting of 97,721,630 people shows a slight positive correlation between the proportion of Immigrants from Armenia and percentage of population with at least bachelor's degree education in the United States with a correlation coefficient (R) of 0.099 and weighted average of 39.4%. Similarly, the statistical analysis conducted on geographies consisting of 239,678,363 people shows no correlation between the proportion of Immigrants from Spain and percentage of population with at least bachelor's degree education in the United States with a correlation coefficient (R) of -0.011 and weighted average of 44.3%, a difference of 12.6%.
Bachelor's Degree Correlation Summary
| Measurement | Immigrants from Armenia | Immigrants from Spain |
| Minimum | 18.0% | 4.4% |
| Maximum | 74.1% | 94.4% |
| Range | 56.1% | 90.0% |
| Mean | 40.7% | 42.5% |
| Median | 40.7% | 43.9% |
| Interquartile 25% (IQ1) | 34.7% | 26.9% |
| Interquartile 75% (IQ3) | 47.3% | 52.9% |
| Interquartile Range (IQR) | 12.6% | 26.1% |
| Standard Deviation (Sample) | 11.0% | 18.3% |
| Standard Deviation (Population) | 10.9% | 18.2% |
Similar Demographics by Bachelor's Degree
Demographics Similar to Immigrants from Armenia by Bachelor's Degree
In terms of bachelor's degree, the demographic groups most similar to Immigrants from Armenia are Immigrants from Sudan (39.4%, a difference of 0.070%), South American Indian (39.3%, a difference of 0.090%), European (39.5%, a difference of 0.27%), Immigrants from North Macedonia (39.2%, a difference of 0.41%), and Icelander (39.5%, a difference of 0.44%).
| Demographics | Rating | Rank | Bachelor's Degree |
| Immigrants | Southern Europe | 91.1 /100 | #133 | Exceptional 40.0% |
| Assyrians/Chaldeans/Syriacs | 89.4 /100 | #134 | Excellent 39.8% |
| Luxembourgers | 89.1 /100 | #135 | Excellent 39.8% |
| Pakistanis | 88.2 /100 | #136 | Excellent 39.7% |
| Icelanders | 86.5 /100 | #137 | Excellent 39.5% |
| Europeans | 85.6 /100 | #138 | Excellent 39.5% |
| Immigrants | Sudan | 84.5 /100 | #139 | Excellent 39.4% |
| Immigrants | Armenia | 84.1 /100 | #140 | Excellent 39.4% |
| South American Indians | 83.6 /100 | #141 | Excellent 39.3% |
| Immigrants | North Macedonia | 81.6 /100 | #142 | Excellent 39.2% |
| Poles | 79.8 /100 | #143 | Good 39.1% |
| Immigrants | Afghanistan | 79.7 /100 | #144 | Good 39.1% |
| Slovenes | 79.5 /100 | #145 | Good 39.1% |
| Swedes | 79.2 /100 | #146 | Good 39.1% |
| Immigrants | Sierra Leone | 79.0 /100 | #147 | Good 39.0% |
Demographics Similar to Immigrants from Spain by Bachelor's Degree
In terms of bachelor's degree, the demographic groups most similar to Immigrants from Spain are Immigrants from Asia (44.3%, a difference of 0.060%), Asian (44.4%, a difference of 0.18%), Immigrants from Austria (44.2%, a difference of 0.24%), Immigrants from Bolivia (44.2%, a difference of 0.25%), and Immigrants from Greece (44.5%, a difference of 0.32%).
| Demographics | Rating | Rank | Bachelor's Degree |
| Immigrants | Kuwait | 99.9 /100 | #45 | Exceptional 44.6% |
| Immigrants | Bulgaria | 99.9 /100 | #46 | Exceptional 44.6% |
| Bolivians | 99.9 /100 | #47 | Exceptional 44.6% |
| Estonians | 99.9 /100 | #48 | Exceptional 44.6% |
| Immigrants | Norway | 99.9 /100 | #49 | Exceptional 44.5% |
| Immigrants | Greece | 99.9 /100 | #50 | Exceptional 44.5% |
| Asians | 99.9 /100 | #51 | Exceptional 44.4% |
| Immigrants | Spain | 99.9 /100 | #52 | Exceptional 44.3% |
| Immigrants | Asia | 99.9 /100 | #53 | Exceptional 44.3% |
| Immigrants | Austria | 99.9 /100 | #54 | Exceptional 44.2% |
| Immigrants | Bolivia | 99.9 /100 | #55 | Exceptional 44.2% |
| Immigrants | Serbia | 99.9 /100 | #56 | Exceptional 44.1% |
| Paraguayans | 99.9 /100 | #57 | Exceptional 44.0% |
| Immigrants | Czechoslovakia | 99.9 /100 | #58 | Exceptional 44.0% |
| Australians | 99.9 /100 | #59 | Exceptional 44.0% |