Immigrants from Armenia vs Choctaw Professional Degree
COMPARE
Immigrants from Armenia
Choctaw
Professional Degree
Professional Degree Comparison
Immigrants from Armenia
Choctaw
4.5%
PROFESSIONAL DEGREE
68.8/ 100
METRIC RATING
158th/ 347
METRIC RANK
3.2%
PROFESSIONAL DEGREE
0.1/ 100
METRIC RATING
319th/ 347
METRIC RANK
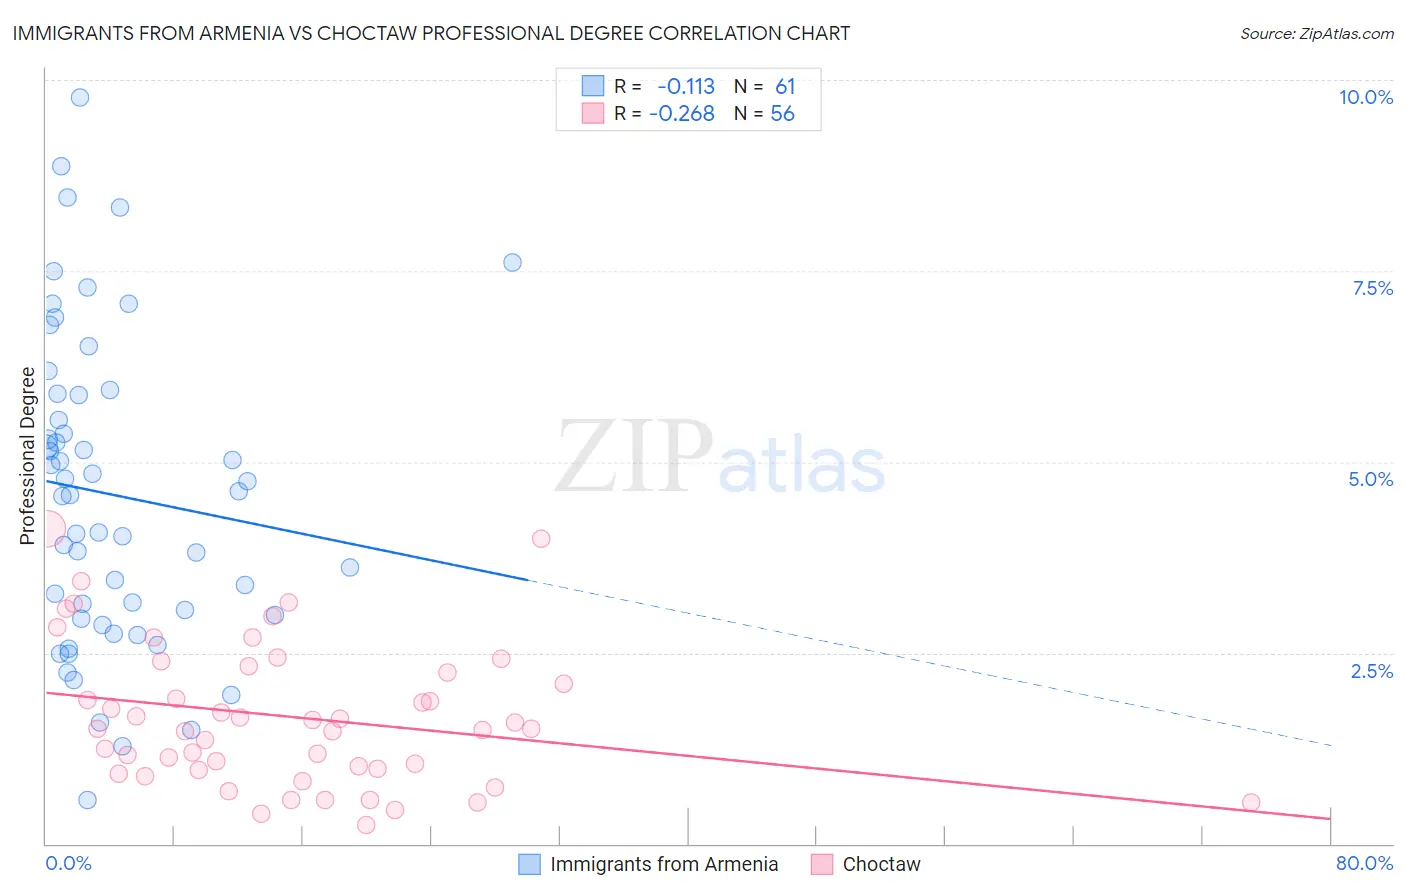
Immigrants from Armenia vs Choctaw Professional Degree Correlation Chart
The statistical analysis conducted on geographies consisting of 97,675,844 people shows a poor negative correlation between the proportion of Immigrants from Armenia and percentage of population with at least professional degree education in the United States with a correlation coefficient (R) of -0.113 and weighted average of 4.5%. Similarly, the statistical analysis conducted on geographies consisting of 268,673,582 people shows a weak negative correlation between the proportion of Choctaw and percentage of population with at least professional degree education in the United States with a correlation coefficient (R) of -0.268 and weighted average of 3.2%, a difference of 40.4%.
Professional Degree Correlation Summary
| Measurement | Immigrants from Armenia | Choctaw |
| Minimum | 0.57% | 0.25% |
| Maximum | 9.8% | 4.1% |
| Range | 9.2% | 3.9% |
| Mean | 4.6% | 1.7% |
| Median | 4.6% | 1.5% |
| Interquartile 25% (IQ1) | 3.0% | 0.97% |
| Interquartile 75% (IQ3) | 5.9% | 2.3% |
| Interquartile Range (IQR) | 2.9% | 1.3% |
| Standard Deviation (Sample) | 2.0% | 0.93% |
| Standard Deviation (Population) | 2.0% | 0.92% |
Similar Demographics by Professional Degree
Demographics Similar to Immigrants from Armenia by Professional Degree
In terms of professional degree, the demographic groups most similar to Immigrants from Armenia are Vietnamese (4.5%, a difference of 0.080%), Immigrants from Senegal (4.5%, a difference of 0.14%), Iraqi (4.5%, a difference of 0.17%), Swedish (4.5%, a difference of 0.18%), and Assyrian/Chaldean/Syriac (4.5%, a difference of 0.24%).
| Demographics | Rating | Rank | Professional Degree |
| Poles | 72.6 /100 | #151 | Good 4.6% |
| Immigrants | Africa | 72.5 /100 | #152 | Good 4.6% |
| Immigrants | Uruguay | 72.5 /100 | #153 | Good 4.6% |
| Scottish | 71.8 /100 | #154 | Good 4.6% |
| Slavs | 70.8 /100 | #155 | Good 4.5% |
| Swedes | 69.9 /100 | #156 | Good 4.5% |
| Iraqis | 69.8 /100 | #157 | Good 4.5% |
| Immigrants | Armenia | 68.8 /100 | #158 | Good 4.5% |
| Vietnamese | 68.4 /100 | #159 | Good 4.5% |
| Immigrants | Senegal | 68.0 /100 | #160 | Good 4.5% |
| Assyrians/Chaldeans/Syriacs | 67.4 /100 | #161 | Good 4.5% |
| Peruvians | 65.2 /100 | #162 | Good 4.5% |
| Sierra Leoneans | 64.3 /100 | #163 | Good 4.5% |
| Swiss | 61.0 /100 | #164 | Good 4.5% |
| Costa Ricans | 59.9 /100 | #165 | Average 4.5% |
Demographics Similar to Choctaw by Professional Degree
In terms of professional degree, the demographic groups most similar to Choctaw are Immigrants from Micronesia (3.2%, a difference of 0.24%), Nepalese (3.2%, a difference of 0.27%), Puerto Rican (3.2%, a difference of 0.48%), Immigrants from Laos (3.2%, a difference of 0.50%), and Seminole (3.2%, a difference of 1.1%).
| Demographics | Rating | Rank | Professional Degree |
| Sioux | 0.1 /100 | #312 | Tragic 3.3% |
| Yuman | 0.1 /100 | #313 | Tragic 3.3% |
| Mexican American Indians | 0.1 /100 | #314 | Tragic 3.3% |
| Immigrants | Laos | 0.1 /100 | #315 | Tragic 3.2% |
| Puerto Ricans | 0.1 /100 | #316 | Tragic 3.2% |
| Nepalese | 0.1 /100 | #317 | Tragic 3.2% |
| Immigrants | Micronesia | 0.1 /100 | #318 | Tragic 3.2% |
| Choctaw | 0.1 /100 | #319 | Tragic 3.2% |
| Seminole | 0.1 /100 | #320 | Tragic 3.2% |
| Tsimshian | 0.0 /100 | #321 | Tragic 3.2% |
| Hispanics or Latinos | 0.0 /100 | #322 | Tragic 3.2% |
| Inupiat | 0.0 /100 | #323 | Tragic 3.2% |
| Crow | 0.0 /100 | #324 | Tragic 3.2% |
| Yaqui | 0.0 /100 | #325 | Tragic 3.2% |
| Menominee | 0.0 /100 | #326 | Tragic 3.1% |