Immigrants from Argentina vs Scottish Associate's Degree
COMPARE
Immigrants from Argentina
Scottish
Associate's Degree
Associate's Degree Comparison
Immigrants from Argentina
Scottish
50.9%
ASSOCIATE'S DEGREE
99.5/ 100
METRIC RATING
70th/ 347
METRIC RANK
46.9%
ASSOCIATE'S DEGREE
65.4/ 100
METRIC RATING
160th/ 347
METRIC RANK
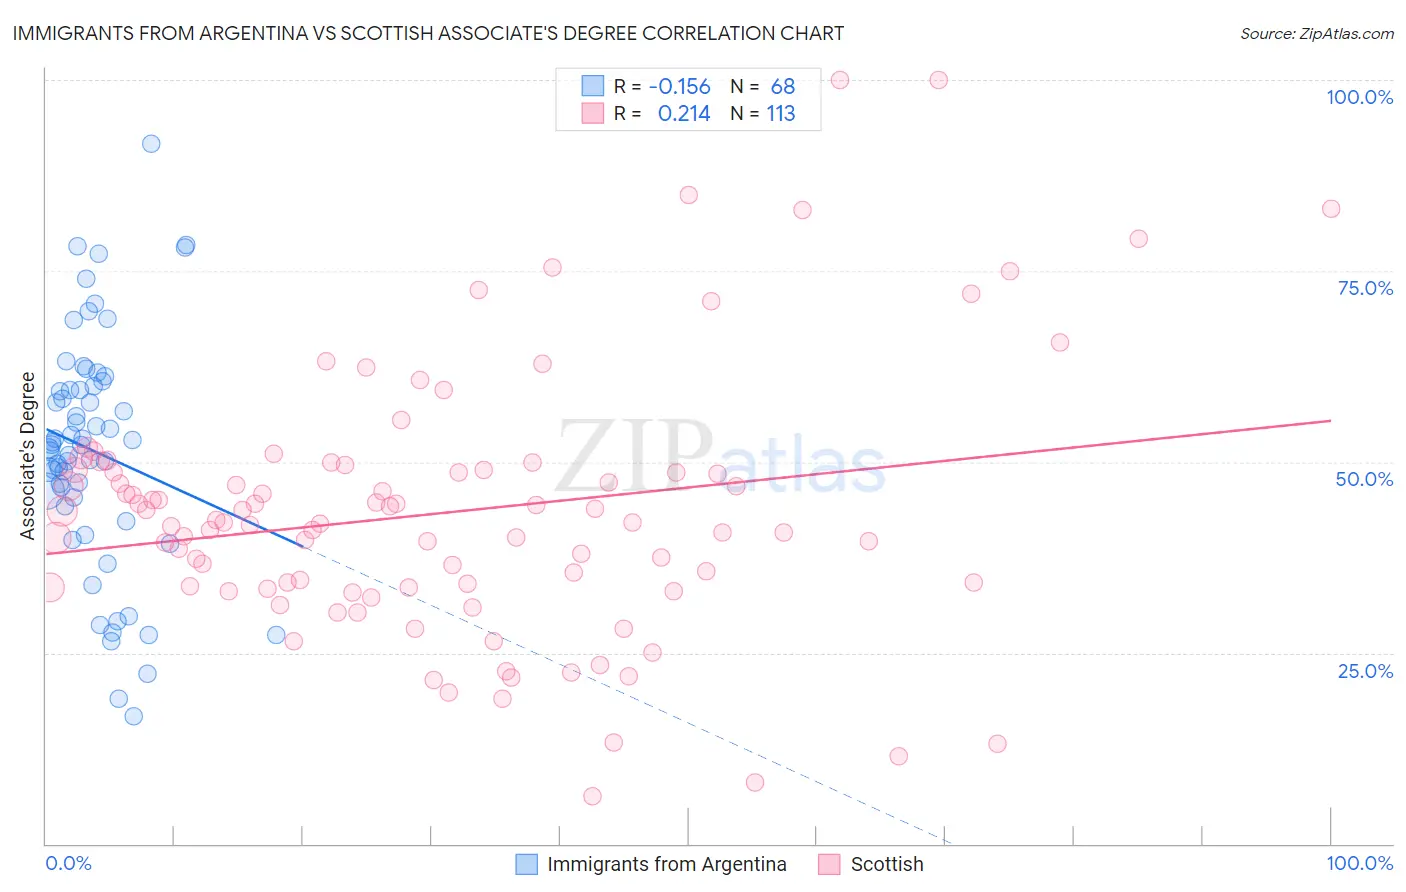
Immigrants from Argentina vs Scottish Associate's Degree Correlation Chart
The statistical analysis conducted on geographies consisting of 264,422,304 people shows a poor negative correlation between the proportion of Immigrants from Argentina and percentage of population with at least associate's degree education in the United States with a correlation coefficient (R) of -0.156 and weighted average of 50.9%. Similarly, the statistical analysis conducted on geographies consisting of 567,065,260 people shows a weak positive correlation between the proportion of Scottish and percentage of population with at least associate's degree education in the United States with a correlation coefficient (R) of 0.214 and weighted average of 46.9%, a difference of 8.6%.
Associate's Degree Correlation Summary
| Measurement | Immigrants from Argentina | Scottish |
| Minimum | 16.7% | 6.2% |
| Maximum | 91.7% | 100.0% |
| Range | 75.0% | 93.7% |
| Mean | 51.4% | 43.3% |
| Median | 52.3% | 42.0% |
| Interquartile 25% (IQ1) | 44.7% | 33.6% |
| Interquartile 75% (IQ3) | 59.7% | 49.0% |
| Interquartile Range (IQR) | 15.0% | 15.4% |
| Standard Deviation (Sample) | 15.2% | 17.2% |
| Standard Deviation (Population) | 15.1% | 17.1% |
Similar Demographics by Associate's Degree
Demographics Similar to Immigrants from Argentina by Associate's Degree
In terms of associate's degree, the demographic groups most similar to Immigrants from Argentina are Immigrants from Romania (50.9%, a difference of 0.010%), Egyptian (50.9%, a difference of 0.030%), Immigrants from Pakistan (50.9%, a difference of 0.070%), Immigrants from Indonesia (51.0%, a difference of 0.15%), and Carpatho Rusyn (50.6%, a difference of 0.54%).
| Demographics | Rating | Rank | Associate's Degree |
| South Africans | 99.7 /100 | #63 | Exceptional 51.4% |
| Immigrants | Netherlands | 99.7 /100 | #64 | Exceptional 51.4% |
| Zimbabweans | 99.7 /100 | #65 | Exceptional 51.3% |
| Immigrants | Europe | 99.7 /100 | #66 | Exceptional 51.3% |
| Argentineans | 99.6 /100 | #67 | Exceptional 51.2% |
| Immigrants | Indonesia | 99.5 /100 | #68 | Exceptional 51.0% |
| Egyptians | 99.5 /100 | #69 | Exceptional 50.9% |
| Immigrants | Argentina | 99.5 /100 | #70 | Exceptional 50.9% |
| Immigrants | Romania | 99.5 /100 | #71 | Exceptional 50.9% |
| Immigrants | Pakistan | 99.5 /100 | #72 | Exceptional 50.9% |
| Carpatho Rusyns | 99.3 /100 | #73 | Exceptional 50.6% |
| Lithuanians | 99.3 /100 | #74 | Exceptional 50.6% |
| Immigrants | Scotland | 99.3 /100 | #75 | Exceptional 50.6% |
| Immigrants | Zimbabwe | 99.2 /100 | #76 | Exceptional 50.5% |
| Immigrants | Lebanon | 99.1 /100 | #77 | Exceptional 50.5% |
Demographics Similar to Scottish by Associate's Degree
In terms of associate's degree, the demographic groups most similar to Scottish are Scandinavian (46.9%, a difference of 0.020%), Immigrants from Africa (46.8%, a difference of 0.18%), Somali (46.8%, a difference of 0.23%), Colombian (46.8%, a difference of 0.24%), and Immigrants from Poland (47.1%, a difference of 0.31%).
| Demographics | Rating | Rank | Associate's Degree |
| Czechs | 72.2 /100 | #153 | Good 47.2% |
| Immigrants | Kenya | 72.1 /100 | #154 | Good 47.2% |
| Kenyans | 70.6 /100 | #155 | Good 47.1% |
| South Americans | 70.5 /100 | #156 | Good 47.1% |
| Sudanese | 70.3 /100 | #157 | Good 47.1% |
| Immigrants | Germany | 69.7 /100 | #158 | Good 47.1% |
| Immigrants | Poland | 69.2 /100 | #159 | Good 47.1% |
| Scottish | 65.4 /100 | #160 | Good 46.9% |
| Scandinavians | 65.2 /100 | #161 | Good 46.9% |
| Immigrants | Africa | 63.2 /100 | #162 | Good 46.8% |
| Somalis | 62.5 /100 | #163 | Good 46.8% |
| Colombians | 62.4 /100 | #164 | Good 46.8% |
| Immigrants | South America | 59.9 /100 | #165 | Average 46.7% |
| Hungarians | 59.3 /100 | #166 | Average 46.7% |
| Immigrants | Sierra Leone | 59.2 /100 | #167 | Average 46.7% |