Immigrants from Argentina vs Mexican 3rd Grade
COMPARE
Immigrants from Argentina
Mexican
3rd Grade
3rd Grade Comparison
Immigrants from Argentina
Mexicans
97.7%
3RD GRADE
37.0/ 100
METRIC RATING
185th/ 347
METRIC RANK
96.2%
3RD GRADE
0.0/ 100
METRIC RATING
332nd/ 347
METRIC RANK
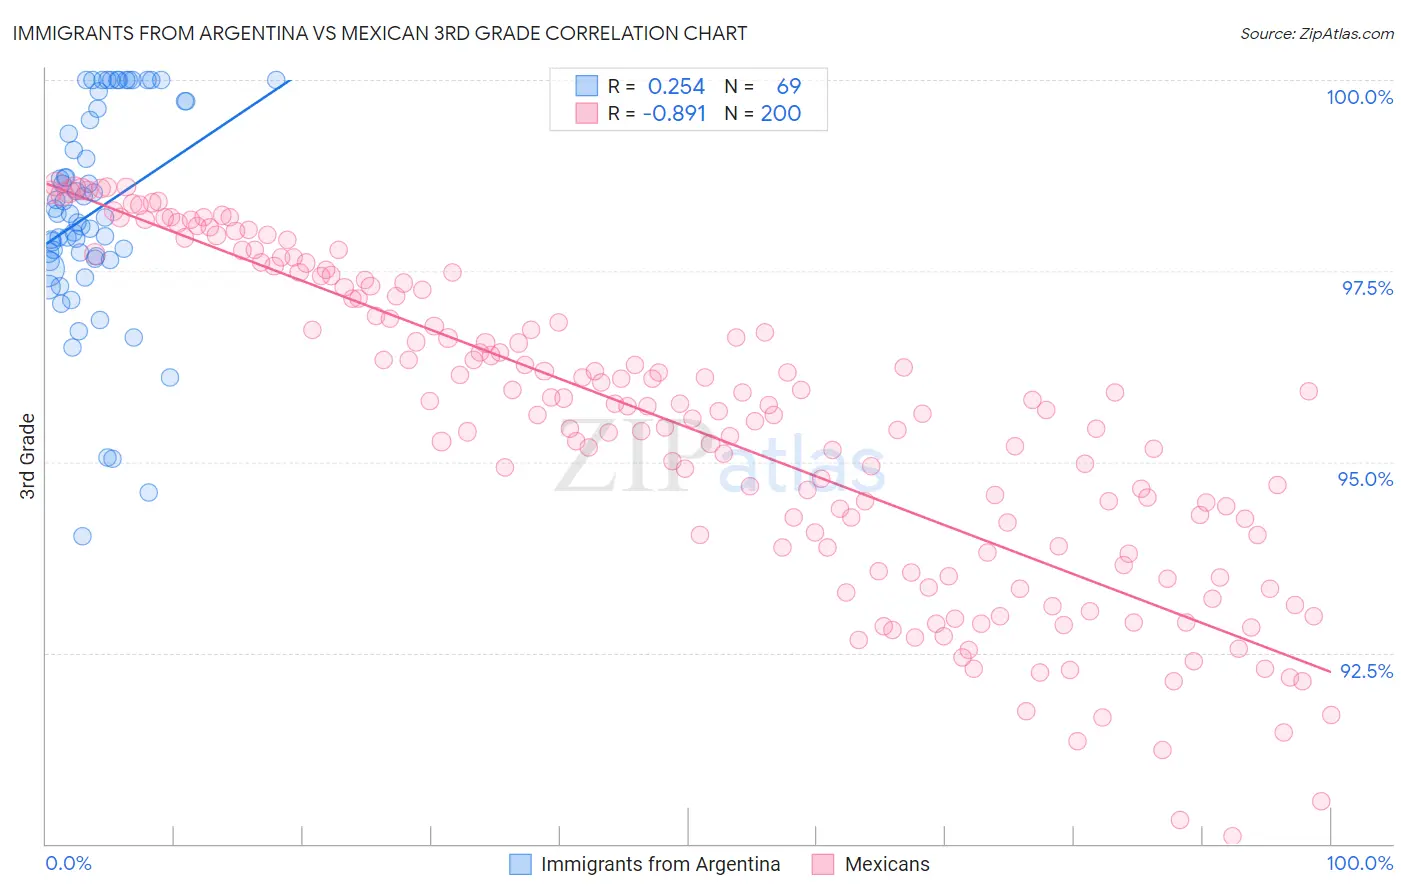
Immigrants from Argentina vs Mexican 3rd Grade Correlation Chart
The statistical analysis conducted on geographies consisting of 264,437,906 people shows a weak positive correlation between the proportion of Immigrants from Argentina and percentage of population with at least 3rd grade education in the United States with a correlation coefficient (R) of 0.254 and weighted average of 97.7%. Similarly, the statistical analysis conducted on geographies consisting of 565,340,458 people shows a very strong negative correlation between the proportion of Mexicans and percentage of population with at least 3rd grade education in the United States with a correlation coefficient (R) of -0.891 and weighted average of 96.2%, a difference of 1.5%.
3rd Grade Correlation Summary
| Measurement | Immigrants from Argentina | Mexican |
| Minimum | 94.0% | 90.1% |
| Maximum | 100.0% | 98.6% |
| Range | 6.0% | 8.5% |
| Mean | 98.3% | 95.4% |
| Median | 98.2% | 95.7% |
| Interquartile 25% (IQ1) | 97.6% | 93.8% |
| Interquartile 75% (IQ3) | 99.7% | 97.3% |
| Interquartile Range (IQR) | 2.0% | 3.4% |
| Standard Deviation (Sample) | 1.4% | 2.1% |
| Standard Deviation (Population) | 1.4% | 2.1% |
Similar Demographics by 3rd Grade
Demographics Similar to Immigrants from Argentina by 3rd Grade
In terms of 3rd grade, the demographic groups most similar to Immigrants from Argentina are Immigrants from Kazakhstan (97.7%, a difference of 0.0%), Portuguese (97.7%, a difference of 0.0%), Arab (97.7%, a difference of 0.010%), Native/Alaskan (97.7%, a difference of 0.010%), and Immigrants from Taiwan (97.7%, a difference of 0.010%).
| Demographics | Rating | Rank | 3rd Grade |
| Immigrants | Brazil | 46.4 /100 | #178 | Average 97.7% |
| Immigrants | Belarus | 45.9 /100 | #179 | Average 97.7% |
| Immigrants | Sri Lanka | 45.1 /100 | #180 | Average 97.7% |
| Immigrants | Venezuela | 44.4 /100 | #181 | Average 97.7% |
| Argentineans | 42.9 /100 | #182 | Average 97.7% |
| Arabs | 40.0 /100 | #183 | Fair 97.7% |
| Immigrants | Kazakhstan | 37.4 /100 | #184 | Fair 97.7% |
| Immigrants | Argentina | 37.0 /100 | #185 | Fair 97.7% |
| Portuguese | 36.2 /100 | #186 | Fair 97.7% |
| Natives/Alaskans | 35.2 /100 | #187 | Fair 97.7% |
| Immigrants | Taiwan | 34.2 /100 | #188 | Fair 97.7% |
| Pakistanis | 34.2 /100 | #189 | Fair 97.7% |
| Panamanians | 31.5 /100 | #190 | Fair 97.7% |
| Blacks/African Americans | 29.6 /100 | #191 | Fair 97.7% |
| Mongolians | 29.1 /100 | #192 | Fair 97.7% |
Demographics Similar to Mexicans by 3rd Grade
In terms of 3rd grade, the demographic groups most similar to Mexicans are Immigrants from Latin America (96.2%, a difference of 0.010%), Immigrants from Armenia (96.3%, a difference of 0.020%), Immigrants from Fiji (96.2%, a difference of 0.030%), Immigrants from Cambodia (96.2%, a difference of 0.050%), and Immigrants from Dominican Republic (96.2%, a difference of 0.050%).
| Demographics | Rating | Rank | 3rd Grade |
| Mexican American Indians | 0.0 /100 | #325 | Tragic 96.4% |
| Immigrants | Vietnam | 0.0 /100 | #326 | Tragic 96.4% |
| Japanese | 0.0 /100 | #327 | Tragic 96.4% |
| Bangladeshis | 0.0 /100 | #328 | Tragic 96.3% |
| Immigrants | Honduras | 0.0 /100 | #329 | Tragic 96.3% |
| Immigrants | Armenia | 0.0 /100 | #330 | Tragic 96.3% |
| Immigrants | Latin America | 0.0 /100 | #331 | Tragic 96.2% |
| Mexicans | 0.0 /100 | #332 | Tragic 96.2% |
| Immigrants | Fiji | 0.0 /100 | #333 | Tragic 96.2% |
| Immigrants | Cambodia | 0.0 /100 | #334 | Tragic 96.2% |
| Immigrants | Dominican Republic | 0.0 /100 | #335 | Tragic 96.2% |
| Immigrants | Cabo Verde | 0.0 /100 | #336 | Tragic 96.2% |
| Central Americans | 0.0 /100 | #337 | Tragic 96.1% |
| Guatemalans | 0.0 /100 | #338 | Tragic 96.0% |
| Yakama | 0.0 /100 | #339 | Tragic 95.9% |