Immigrants from Argentina vs Immigrants from El Salvador College, Under 1 year
COMPARE
Immigrants from Argentina
Immigrants from El Salvador
College, Under 1 year
College, Under 1 year Comparison
Immigrants from Argentina
Immigrants from El Salvador
67.9%
COLLEGE, UNDER 1 YEAR
97.0/ 100
METRIC RATING
100th/ 347
METRIC RANK
56.4%
COLLEGE, UNDER 1 YEAR
0.0/ 100
METRIC RATING
324th/ 347
METRIC RANK
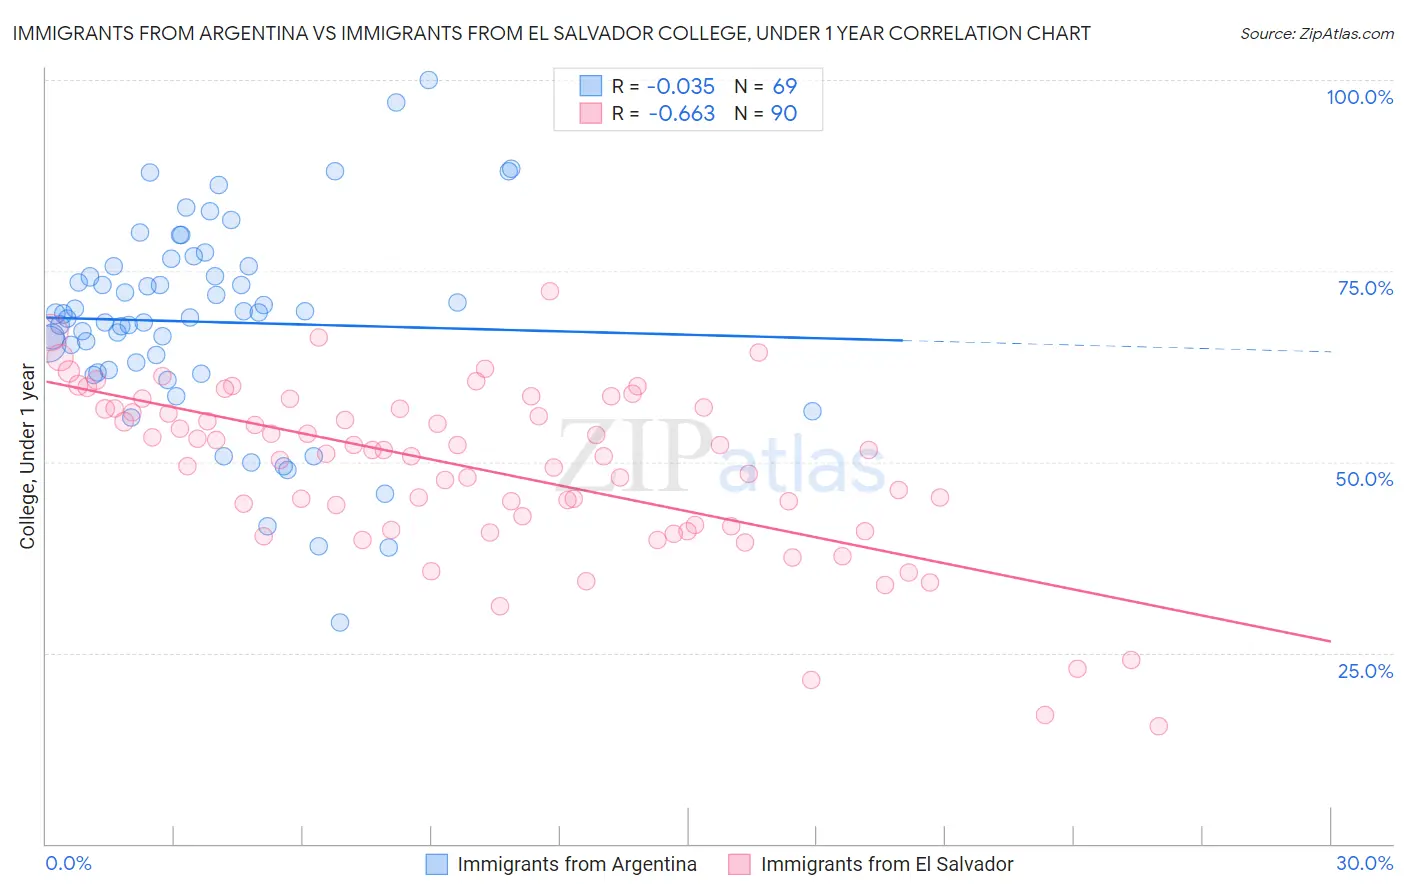
Immigrants from Argentina vs Immigrants from El Salvador College, Under 1 year Correlation Chart
The statistical analysis conducted on geographies consisting of 264,437,906 people shows no correlation between the proportion of Immigrants from Argentina and percentage of population with at least college, under 1 year education in the United States with a correlation coefficient (R) of -0.035 and weighted average of 67.9%. Similarly, the statistical analysis conducted on geographies consisting of 357,850,135 people shows a significant negative correlation between the proportion of Immigrants from El Salvador and percentage of population with at least college, under 1 year education in the United States with a correlation coefficient (R) of -0.663 and weighted average of 56.4%, a difference of 20.4%.
College, Under 1 year Correlation Summary
| Measurement | Immigrants from Argentina | Immigrants from El Salvador |
| Minimum | 29.0% | 15.3% |
| Maximum | 100.0% | 72.3% |
| Range | 71.0% | 56.9% |
| Mean | 68.3% | 48.9% |
| Median | 69.3% | 51.3% |
| Interquartile 25% (IQ1) | 61.9% | 41.6% |
| Interquartile 75% (IQ3) | 75.6% | 57.0% |
| Interquartile Range (IQR) | 13.7% | 15.4% |
| Standard Deviation (Sample) | 13.4% | 11.1% |
| Standard Deviation (Population) | 13.3% | 11.1% |
Similar Demographics by College, Under 1 year
Demographics Similar to Immigrants from Argentina by College, Under 1 year
In terms of college, under 1 year, the demographic groups most similar to Immigrants from Argentina are Immigrants from Bolivia (67.9%, a difference of 0.010%), Paraguayan (67.9%, a difference of 0.030%), Immigrants from Eastern Europe (67.9%, a difference of 0.050%), Palestinian (67.9%, a difference of 0.050%), and Carpatho Rusyn (67.9%, a difference of 0.060%).
| Demographics | Rating | Rank | College, Under 1 year |
| Romanians | 97.9 /100 | #93 | Exceptional 68.2% |
| Armenians | 97.7 /100 | #94 | Exceptional 68.1% |
| Immigrants | Pakistan | 97.5 /100 | #95 | Exceptional 68.0% |
| Jordanians | 97.4 /100 | #96 | Exceptional 68.0% |
| Immigrants | Ethiopia | 97.3 /100 | #97 | Exceptional 68.0% |
| Paraguayans | 97.1 /100 | #98 | Exceptional 67.9% |
| Immigrants | Bolivia | 97.0 /100 | #99 | Exceptional 67.9% |
| Immigrants | Argentina | 97.0 /100 | #100 | Exceptional 67.9% |
| Immigrants | Eastern Europe | 96.9 /100 | #101 | Exceptional 67.9% |
| Palestinians | 96.9 /100 | #102 | Exceptional 67.9% |
| Carpatho Rusyns | 96.8 /100 | #103 | Exceptional 67.9% |
| Immigrants | Western Asia | 96.6 /100 | #104 | Exceptional 67.8% |
| Afghans | 96.6 /100 | #105 | Exceptional 67.8% |
| Immigrants | Croatia | 96.6 /100 | #106 | Exceptional 67.8% |
| Austrians | 96.4 /100 | #107 | Exceptional 67.8% |
Demographics Similar to Immigrants from El Salvador by College, Under 1 year
In terms of college, under 1 year, the demographic groups most similar to Immigrants from El Salvador are Immigrants from Latin America (56.3%, a difference of 0.10%), Immigrants from Honduras (56.5%, a difference of 0.13%), Navajo (56.3%, a difference of 0.25%), Immigrants from Caribbean (56.6%, a difference of 0.31%), and Immigrants from Guatemala (56.2%, a difference of 0.34%).
| Demographics | Rating | Rank | College, Under 1 year |
| Hispanics or Latinos | 0.0 /100 | #317 | Tragic 57.0% |
| Immigrants | Haiti | 0.0 /100 | #318 | Tragic 56.9% |
| Puerto Ricans | 0.0 /100 | #319 | Tragic 56.8% |
| Guatemalans | 0.0 /100 | #320 | Tragic 56.8% |
| Natives/Alaskans | 0.0 /100 | #321 | Tragic 56.6% |
| Immigrants | Caribbean | 0.0 /100 | #322 | Tragic 56.6% |
| Immigrants | Honduras | 0.0 /100 | #323 | Tragic 56.5% |
| Immigrants | El Salvador | 0.0 /100 | #324 | Tragic 56.4% |
| Immigrants | Latin America | 0.0 /100 | #325 | Tragic 56.3% |
| Navajo | 0.0 /100 | #326 | Tragic 56.3% |
| Immigrants | Guatemala | 0.0 /100 | #327 | Tragic 56.2% |
| Cape Verdeans | 0.0 /100 | #328 | Tragic 56.0% |
| Immigrants | Cuba | 0.0 /100 | #329 | Tragic 55.7% |
| Mexicans | 0.0 /100 | #330 | Tragic 55.6% |
| Dominicans | 0.0 /100 | #331 | Tragic 55.5% |