Immigrants from Albania vs Russian 2nd Grade

COMPARE

Immigrants from Albania
Race
Ancestry
AfghanAfricanAlaska NativeAlaskan AthabascanAlbanianAleutAlsatianAmericanApacheArabArapahoArgentineanArmenianAssyrian/Chaldean/SyriacAustralianAustrianBahamianBangladeshiBarbadianBasqueBelgianBelizeanBermudanBhutaneseBlackfeetBolivianBrazilianBritishBritish West IndianBulgarianBurmeseCajunCambodianCanadianCape VerdeanCarpatho RusynCelticCentral AmericanCentral American IndianCherokeeCheyenneChickasawChileanChineseChippewaChoctawColombianColvilleComancheCosta RicanCreeCreekCroatianCrowCubanCypriotCzechCzechoslovakianDanishDelawareDominicanDutchDutch West IndianEastern EuropeanEcuadorianEgyptianEnglishEstonianEthiopianEuropeanFijianFilipinoFinnishFrenchFrench American IndianFrench CanadianGermanGerman RussianGhanaianGreekGuamanian/ChamorroGuatemalanGuyaneseHaitianHmongHonduranHopiHoumaHungarianIcelanderIndian (Asian)IndonesianInupiatIranianIraqiIrishIroquoisIsraeliItalianJamaicanJapaneseJordanianKenyanKiowaKoreanLaotianLatvianLebaneseLiberianLithuanianLumbeeLuxembourgerMacedonianMalaysianMalteseMarshalleseMenomineeMexicanMexican American IndianMongolianMoroccanNative HawaiianNavajoNepaleseNew ZealanderNicaraguanNigerianNorthern EuropeanNorwegianOkinawanOsageOttawaPaiutePakistaniPalestinianPanamanianParaguayanPennsylvania GermanPeruvianPimaPolishPortuguesePotawatomiPuebloPuerto RicanPuget Sound SalishRomanianSalvadoranSamoanScandinavianScotch-IrishScottishSeminoleSenegaleseSerbianShoshoneSierra LeoneanSiouxSlavicSlovakSloveneSomaliSouth AfricanSouth AmericanSouth American IndianSoviet UnionSpaniardSpanishSpanish AmericanSpanish American IndianSri LankanSubsaharan AfricanSudaneseSwedishSwissSyrianTaiwaneseThaiTlingit-HaidaTohono O'OdhamTonganTrinidadian and TobagonianTsimshianTurkishU.S. Virgin IslanderUgandanUkrainianUruguayanUteVenezuelanVietnameseWelshWest IndianYakamaYaquiYugoslavianYumanYup'ikZimbabwean
Immigration
NonimmigrantsImmigrantsAfghanistanAfricaAlbaniaArgentinaArmeniaAsiaAustraliaAustriaBahamasBangladeshBarbadosBelarusBelgiumBelizeBoliviaBosnia and HerzegovinaBrazilBulgariaBurma/MyanmarCabo VerdeCambodiaCameroonCanadaCaribbeanCentral AmericaChileChinaColombiaCongoCosta RicaCroatiaCubaCzechoslovakiaDenmarkDominicaDominican RepublicEastern AfricaEastern AsiaEastern EuropeEcuadorEgyptEl SalvadorEnglandEritreaEthiopiaEuropeFijiFranceGermanyGhanaGreeceGrenadaGuatemalaGuyanaHaitiHondurasHong KongHungaryIndiaIndonesiaIranIraqIrelandIsraelItalyJamaicaJapanJordanKazakhstanKenyaKoreaKuwaitLaosLatin AmericaLatviaLebanonLiberiaLithuaniaMalaysiaMexicoMicronesiaMiddle AfricaMoldovaMoroccoNepalNetherlandsNicaraguaNigeriaNorth AmericaNorth MacedoniaNorthern AfricaNorthern EuropeNorwayOceaniaPakistanPanamaPeruPhilippinesPolandPortugalRomaniaRussiaSaudi ArabiaScotlandSenegalSerbiaSierra LeoneSingaporeSomaliaSouth AfricaSouth AmericaSouth Central AsiaSouth Eastern AsiaSouthern EuropeSpainSri LankaSt. Vincent and the GrenadinesSudanSwedenSwitzerlandSyriaTaiwanThailandTrinidad and TobagoTurkeyUgandaUkraineUruguayUzbekistanVenezuelaVietnamWest IndiesWestern AfricaWestern AsiaWestern EuropeYemenZaireZimbabweAzores
Russian
Race
Ancestry
AfghanAfricanAlaska NativeAlaskan AthabascanAlbanianAleutAlsatianAmericanApacheArabArapahoArgentineanArmenianAssyrian/Chaldean/SyriacAustralianAustrianBahamianBangladeshiBarbadianBasqueBelgianBelizeanBermudanBhutaneseBlackfeetBolivianBrazilianBritishBritish West IndianBulgarianBurmeseCajunCambodianCanadianCape VerdeanCarpatho RusynCelticCentral AmericanCentral American IndianCherokeeCheyenneChickasawChileanChineseChippewaChoctawColombianColvilleComancheCosta RicanCreeCreekCroatianCrowCubanCypriotCzechCzechoslovakianDanishDelawareDominicanDutchDutch West IndianEastern EuropeanEcuadorianEgyptianEnglishEstonianEthiopianEuropeanFijianFilipinoFinnishFrenchFrench American IndianFrench CanadianGermanGerman RussianGhanaianGreekGuamanian/ChamorroGuatemalanGuyaneseHaitianHmongHonduranHopiHoumaHungarianIcelanderIndian (Asian)IndonesianInupiatIranianIraqiIrishIroquoisIsraeliItalianJamaicanJapaneseJordanianKenyanKiowaKoreanLaotianLatvianLebaneseLiberianLithuanianLumbeeLuxembourgerMacedonianMalaysianMalteseMarshalleseMenomineeMexicanMexican American IndianMongolianMoroccanNative HawaiianNavajoNepaleseNew ZealanderNicaraguanNigerianNorthern EuropeanNorwegianOkinawanOsageOttawaPaiutePakistaniPalestinianPanamanianParaguayanPennsylvania GermanPeruvianPimaPolishPortuguesePotawatomiPuebloPuerto RicanPuget Sound SalishRomanianRussianSalvadoranSamoanScandinavianScotch-IrishScottishSeminoleSenegaleseSerbianShoshoneSierra LeoneanSiouxSlavicSlovakSloveneSomaliSouth AfricanSouth AmericanSouth American IndianSoviet UnionSpaniardSpanishSpanish AmericanSpanish American IndianSri LankanSubsaharan AfricanSudaneseSwedishSwissSyrianTaiwaneseThaiTlingit-HaidaTohono O'OdhamTonganTrinidadian and TobagonianTsimshianTurkishU.S. Virgin IslanderUgandanUkrainianUruguayanUteVenezuelanVietnameseWelshWest IndianYakamaYaquiYugoslavianYumanYup'ikZimbabwean
Immigration
NonimmigrantsImmigrantsAfghanistanAfricaArgentinaArmeniaAsiaAustraliaAustriaBahamasBangladeshBarbadosBelarusBelgiumBelizeBoliviaBosnia and HerzegovinaBrazilBulgariaBurma/MyanmarCabo VerdeCambodiaCameroonCanadaCaribbeanCentral AmericaChileChinaColombiaCongoCosta RicaCroatiaCubaCzechoslovakiaDenmarkDominicaDominican RepublicEastern AfricaEastern AsiaEastern EuropeEcuadorEgyptEl SalvadorEnglandEritreaEthiopiaEuropeFijiFranceGermanyGhanaGreeceGrenadaGuatemalaGuyanaHaitiHondurasHong KongHungaryIndiaIndonesiaIranIraqIrelandIsraelItalyJamaicaJapanJordanKazakhstanKenyaKoreaKuwaitLaosLatin AmericaLatviaLebanonLiberiaLithuaniaMalaysiaMexicoMicronesiaMiddle AfricaMoldovaMoroccoNepalNetherlandsNicaraguaNigeriaNorth AmericaNorth MacedoniaNorthern AfricaNorthern EuropeNorwayOceaniaPakistanPanamaPeruPhilippinesPolandPortugalRomaniaRussiaSaudi ArabiaScotlandSenegalSerbiaSierra LeoneSingaporeSomaliaSouth AfricaSouth AmericaSouth Central AsiaSouth Eastern AsiaSouthern EuropeSpainSri LankaSt. Vincent and the GrenadinesSudanSwedenSwitzerlandSyriaTaiwanThailandTrinidad and TobagoTurkeyUgandaUkraineUruguayUzbekistanVenezuelaVietnamWest IndiesWestern AfricaWestern AsiaWestern EuropeYemenZaireZimbabweAzores
2nd Grade
Income
Poverty
Unemployment
Labor Participation
Family Structure
Vehicle Availability
Education Level
Disability

2nd Grade Comparison

Immigrants from Albania

Russians

Poor
Exceptional
97.8%
2ND GRADE
18.4/ 100
METRIC RATING
204th/ 347
METRIC RANK
98.3%
2ND GRADE
99.7/ 100
METRIC RATING
68th/ 347
METRIC RANK

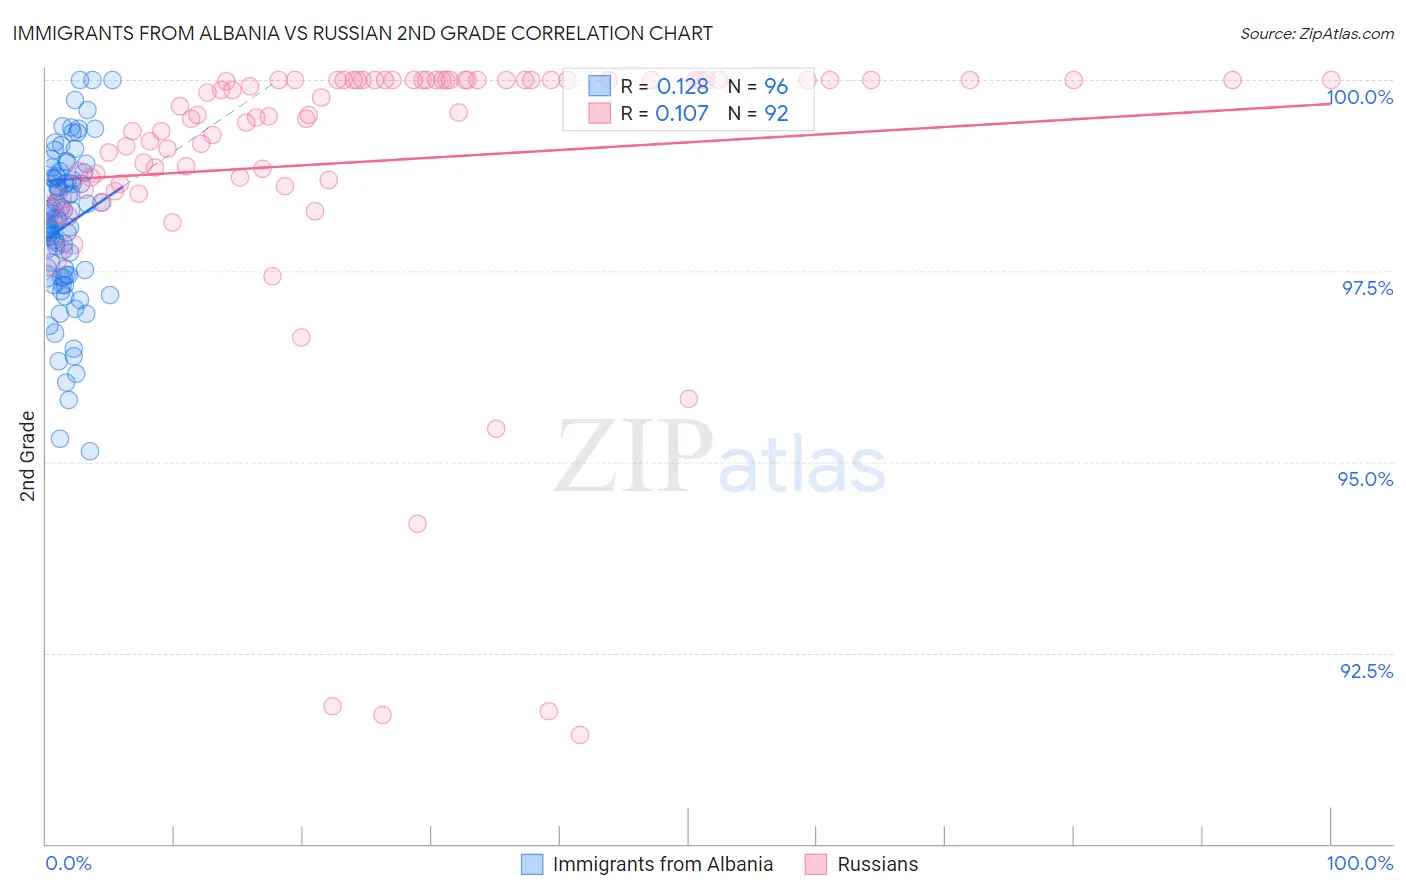
Immigrants from Albania vs Russian 2nd Grade Correlation Chart

The statistical analysis conducted on geographies consisting of 119,263,578 people shows a poor positive correlation between the proportion of Immigrants from Albania and percentage of population with at least 2nd grade education in the United States with a correlation coefficient (R) of 0.128 and weighted average of 97.8%. Similarly, the statistical analysis conducted on geographies consisting of 512,259,139 people shows a poor positive correlation between the proportion of Russians and percentage of population with at least 2nd grade education in the United States with a correlation coefficient (R) of 0.107 and weighted average of 98.3%, a difference of 0.56%.
Immigrants from Albania vs Russian 2nd Grade

2nd Grade Correlation Summary

MeasurementImmigrants from AlbaniaRussian
Minimum95.1%91.4%
Maximum100.0%100.0%
Range4.9%8.6%
Mean98.1%98.9%
Median98.2%99.6%
Interquartile 25% (IQ1)97.4%98.7%
Interquartile 75% (IQ3)98.7%100.0%
Interquartile Range (IQR)1.3%1.3%
Standard Deviation (Sample)1.00%1.9%
Standard Deviation (Population)0.99%1.9%

Similar Demographics by 2nd Grade

Demographics Similar to Immigrants from Albania by 2nd Grade

In terms of 2nd grade, the demographic groups most similar to Immigrants from Albania are Immigrants from Southern Europe (97.8%, a difference of 0.0%), Immigrants from Lebanon (97.8%, a difference of 0.010%), Tohono O'odham (97.8%, a difference of 0.010%), Immigrants from Ukraine (97.8%, a difference of 0.010%), and Yuman (97.8%, a difference of 0.010%).
DemographicsRating | Rank2nd Grade
Immigrants | Uganda
26.3
/100
|
#197
Fair
97.8%
Guamanians/Chamorros
25.7
/100
|
#198
Fair
97.8%
Immigrants | Egypt
24.4
/100
|
#199
Fair
97.8%
Immigrants | Lebanon
20.9
/100
|
#200
Fair
97.8%
Tohono O'odham
20.9
/100
|
#201
Fair
97.8%
Immigrants | Ukraine
20.5
/100
|
#202
Fair
97.8%
Yuman
20.0
/100
|
#203
Fair
97.8%
Immigrants | Albania
18.4
/100
|
#204
Poor
97.8%
Immigrants | Southern Europe
18.1
/100
|
#205
Poor
97.8%
Immigrants | Chile
17.3
/100
|
#206
Poor
97.7%
Africans
15.6
/100
|
#207
Poor
97.7%
Immigrants | Northern Africa
12.3
/100
|
#208
Poor
97.7%
Immigrants | Oceania
10.9
/100
|
#209
Poor
97.7%
Costa Ricans
10.5
/100
|
#210
Poor
97.7%
Laotians
9.9
/100
|
#211
Tragic
97.7%

Demographics Similar to Russians by 2nd Grade

In terms of 2nd grade, the demographic groups most similar to Russians are Canadian (98.3%, a difference of 0.0%), Immigrants from Northern Europe (98.3%, a difference of 0.0%), Immigrants from Austria (98.3%, a difference of 0.0%), Serbian (98.3%, a difference of 0.0%), and Chickasaw (98.3%, a difference of 0.010%).
DemographicsRating | Rank2nd Grade
Immigrants | Canada
99.8
/100
|
#61
Exceptional
98.3%
Greeks
99.8
/100
|
#62
Exceptional
98.3%
Maltese
99.7
/100
|
#63
Exceptional
98.3%
Immigrants | North America
99.7
/100
|
#64
Exceptional
98.3%
New Zealanders
99.7
/100
|
#65
Exceptional
98.3%
Canadians
99.7
/100
|
#66
Exceptional
98.3%
Immigrants | Northern Europe
99.7
/100
|
#67
Exceptional
98.3%
Russians
99.7
/100
|
#68
Exceptional
98.3%
Immigrants | Austria
99.6
/100
|
#69
Exceptional
98.3%
Serbians
99.6
/100
|
#70
Exceptional
98.3%
Chickasaw
99.6
/100
|
#71
Exceptional
98.3%
Cheyenne
99.6
/100
|
#72
Exceptional
98.3%
Cajuns
99.5
/100
|
#73
Exceptional
98.3%
Immigrants | Netherlands
99.4
/100
|
#74
Exceptional
98.3%
Shoshone
99.4
/100
|
#75
Exceptional
98.3%