Immigrants from Albania vs Navajo GED/Equivalency

COMPARE

Immigrants from Albania
Race
Ancestry
AfghanAfricanAlaska NativeAlaskan AthabascanAlbanianAleutAlsatianAmericanApacheArabArapahoArgentineanArmenianAssyrian/Chaldean/SyriacAustralianAustrianBahamianBangladeshiBarbadianBasqueBelgianBelizeanBermudanBhutaneseBlackfeetBolivianBrazilianBritishBritish West IndianBulgarianBurmeseCajunCambodianCanadianCape VerdeanCarpatho RusynCelticCentral AmericanCentral American IndianCherokeeCheyenneChickasawChileanChineseChippewaChoctawColombianColvilleComancheCosta RicanCreeCreekCroatianCrowCubanCypriotCzechCzechoslovakianDanishDelawareDominicanDutchDutch West IndianEastern EuropeanEcuadorianEgyptianEnglishEstonianEthiopianEuropeanFijianFilipinoFinnishFrenchFrench American IndianFrench CanadianGermanGerman RussianGhanaianGreekGuamanian/ChamorroGuatemalanGuyaneseHaitianHmongHonduranHopiHoumaHungarianIcelanderIndian (Asian)IndonesianInupiatIranianIraqiIrishIroquoisIsraeliItalianJamaicanJapaneseJordanianKenyanKiowaKoreanLaotianLatvianLebaneseLiberianLithuanianLumbeeLuxembourgerMacedonianMalaysianMalteseMarshalleseMenomineeMexicanMexican American IndianMongolianMoroccanNative HawaiianNepaleseNew ZealanderNicaraguanNigerianNorthern EuropeanNorwegianOkinawanOsageOttawaPaiutePakistaniPalestinianPanamanianParaguayanPennsylvania GermanPeruvianPimaPolishPortuguesePotawatomiPuebloPuerto RicanPuget Sound SalishRomanianRussianSalvadoranSamoanScandinavianScotch-IrishScottishSeminoleSenegaleseSerbianShoshoneSierra LeoneanSiouxSlavicSlovakSloveneSomaliSouth AfricanSouth AmericanSouth American IndianSoviet UnionSpaniardSpanishSpanish AmericanSpanish American IndianSri LankanSubsaharan AfricanSudaneseSwedishSwissSyrianTaiwaneseThaiTlingit-HaidaTohono O'OdhamTonganTrinidadian and TobagonianTsimshianTurkishU.S. Virgin IslanderUgandanUkrainianUruguayanUteVenezuelanVietnameseWelshWest IndianYakamaYaquiYugoslavianYumanYup'ikZimbabwean
Immigration
NonimmigrantsImmigrantsAfghanistanAfricaAlbaniaArgentinaArmeniaAsiaAustraliaAustriaBahamasBangladeshBarbadosBelarusBelgiumBelizeBoliviaBosnia and HerzegovinaBrazilBulgariaBurma/MyanmarCabo VerdeCambodiaCameroonCanadaCaribbeanCentral AmericaChileChinaColombiaCongoCosta RicaCroatiaCubaCzechoslovakiaDenmarkDominicaDominican RepublicEastern AfricaEastern AsiaEastern EuropeEcuadorEgyptEl SalvadorEnglandEritreaEthiopiaEuropeFijiFranceGermanyGhanaGreeceGrenadaGuatemalaGuyanaHaitiHondurasHong KongHungaryIndiaIndonesiaIranIraqIrelandIsraelItalyJamaicaJapanJordanKazakhstanKenyaKoreaKuwaitLaosLatin AmericaLatviaLebanonLiberiaLithuaniaMalaysiaMexicoMicronesiaMiddle AfricaMoldovaMoroccoNepalNetherlandsNicaraguaNigeriaNorth AmericaNorth MacedoniaNorthern AfricaNorthern EuropeNorwayOceaniaPakistanPanamaPeruPhilippinesPolandPortugalRomaniaRussiaSaudi ArabiaScotlandSenegalSerbiaSierra LeoneSingaporeSomaliaSouth AfricaSouth AmericaSouth Central AsiaSouth Eastern AsiaSouthern EuropeSpainSri LankaSt. Vincent and the GrenadinesSudanSwedenSwitzerlandSyriaTaiwanThailandTrinidad and TobagoTurkeyUgandaUkraineUruguayUzbekistanVenezuelaVietnamWest IndiesWestern AfricaWestern AsiaWestern EuropeYemenZaireZimbabweAzores
Navajo
Race
Ancestry
AfghanAfricanAlaska NativeAlaskan AthabascanAlbanianAleutAlsatianAmericanApacheArabArapahoArgentineanArmenianAssyrian/Chaldean/SyriacAustralianAustrianBahamianBangladeshiBarbadianBasqueBelgianBelizeanBermudanBhutaneseBlackfeetBolivianBrazilianBritishBritish West IndianBulgarianBurmeseCajunCambodianCanadianCape VerdeanCarpatho RusynCelticCentral AmericanCentral American IndianCherokeeCheyenneChickasawChileanChineseChippewaChoctawColombianColvilleComancheCosta RicanCreeCreekCroatianCrowCubanCypriotCzechCzechoslovakianDanishDelawareDominicanDutchDutch West IndianEastern EuropeanEcuadorianEgyptianEnglishEstonianEthiopianEuropeanFijianFilipinoFinnishFrenchFrench American IndianFrench CanadianGermanGerman RussianGhanaianGreekGuamanian/ChamorroGuatemalanGuyaneseHaitianHmongHonduranHopiHoumaHungarianIcelanderIndian (Asian)IndonesianInupiatIranianIraqiIrishIroquoisIsraeliItalianJamaicanJapaneseJordanianKenyanKiowaKoreanLaotianLatvianLebaneseLiberianLithuanianLumbeeLuxembourgerMacedonianMalaysianMalteseMarshalleseMenomineeMexicanMexican American IndianMongolianMoroccanNative HawaiianNavajoNepaleseNew ZealanderNicaraguanNigerianNorthern EuropeanNorwegianOkinawanOsageOttawaPaiutePakistaniPalestinianPanamanianParaguayanPennsylvania GermanPeruvianPimaPolishPortuguesePotawatomiPuebloPuerto RicanPuget Sound SalishRomanianRussianSalvadoranSamoanScandinavianScotch-IrishScottishSeminoleSenegaleseSerbianShoshoneSierra LeoneanSiouxSlavicSlovakSloveneSomaliSouth AfricanSouth AmericanSouth American IndianSoviet UnionSpaniardSpanishSpanish AmericanSpanish American IndianSri LankanSubsaharan AfricanSudaneseSwedishSwissSyrianTaiwaneseThaiTlingit-HaidaTohono O'OdhamTonganTrinidadian and TobagonianTsimshianTurkishU.S. Virgin IslanderUgandanUkrainianUruguayanUteVenezuelanVietnameseWelshWest IndianYakamaYaquiYugoslavianYumanYup'ikZimbabwean
Immigration
NonimmigrantsImmigrantsAfghanistanAfricaArgentinaArmeniaAsiaAustraliaAustriaBahamasBangladeshBarbadosBelarusBelgiumBelizeBoliviaBosnia and HerzegovinaBrazilBulgariaBurma/MyanmarCabo VerdeCambodiaCameroonCanadaCaribbeanCentral AmericaChileChinaColombiaCongoCosta RicaCroatiaCubaCzechoslovakiaDenmarkDominicaDominican RepublicEastern AfricaEastern AsiaEastern EuropeEcuadorEgyptEl SalvadorEnglandEritreaEthiopiaEuropeFijiFranceGermanyGhanaGreeceGrenadaGuatemalaGuyanaHaitiHondurasHong KongHungaryIndiaIndonesiaIranIraqIrelandIsraelItalyJamaicaJapanJordanKazakhstanKenyaKoreaKuwaitLaosLatin AmericaLatviaLebanonLiberiaLithuaniaMalaysiaMexicoMicronesiaMiddle AfricaMoldovaMoroccoNepalNetherlandsNicaraguaNigeriaNorth AmericaNorth MacedoniaNorthern AfricaNorthern EuropeNorwayOceaniaPakistanPanamaPeruPhilippinesPolandPortugalRomaniaRussiaSaudi ArabiaScotlandSenegalSerbiaSierra LeoneSingaporeSomaliaSouth AfricaSouth AmericaSouth Central AsiaSouth Eastern AsiaSouthern EuropeSpainSri LankaSt. Vincent and the GrenadinesSudanSwedenSwitzerlandSyriaTaiwanThailandTrinidad and TobagoTurkeyUgandaUkraineUruguayUzbekistanVenezuelaVietnamWest IndiesWestern AfricaWestern AsiaWestern EuropeYemenZaireZimbabweAzores
GED/Equivalency
Income
Poverty
Unemployment
Labor Participation
Family Structure
Vehicle Availability
Education Level
Disability

GED/Equivalency Comparison

Immigrants from Albania

Navajo

Good
Tragic
86.0%
GED/EQUIVALENCY
64.2/ 100
METRIC RATING
166th/ 347
METRIC RANK
81.5%
GED/EQUIVALENCY
0.0/ 100
METRIC RATING
304th/ 347
METRIC RANK

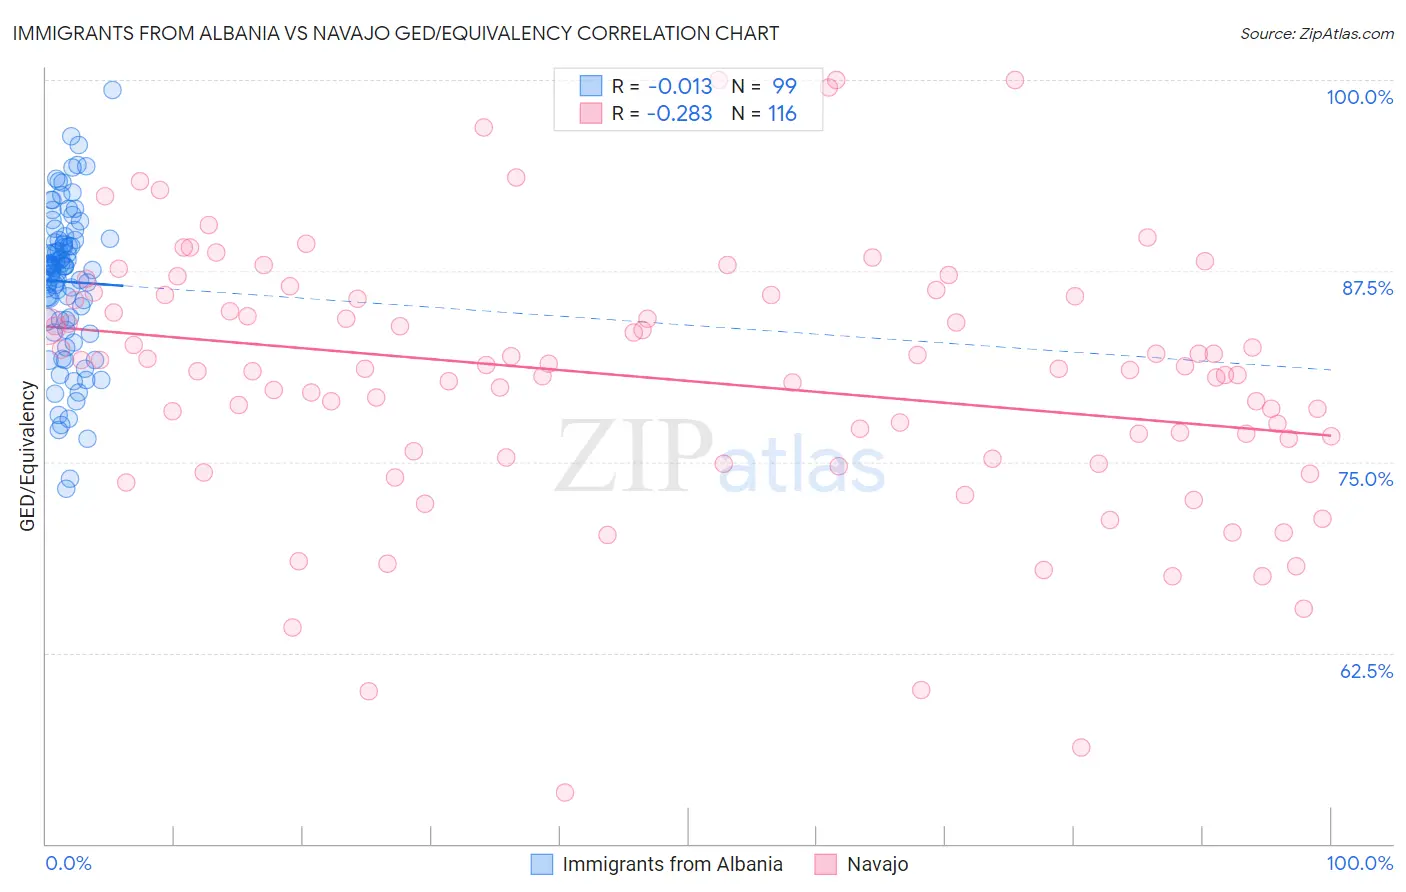
Immigrants from Albania vs Navajo GED/Equivalency Correlation Chart

The statistical analysis conducted on geographies consisting of 119,401,336 people shows no correlation between the proportion of Immigrants from Albania and percentage of population with at least ged/equivalency education in the United States with a correlation coefficient (R) of -0.013 and weighted average of 86.0%. Similarly, the statistical analysis conducted on geographies consisting of 224,872,856 people shows a weak negative correlation between the proportion of Navajo and percentage of population with at least ged/equivalency education in the United States with a correlation coefficient (R) of -0.283 and weighted average of 81.5%, a difference of 5.6%.
Immigrants from Albania vs Navajo GED/Equivalency

GED/Equivalency Correlation Summary

MeasurementImmigrants from AlbaniaNavajo
Minimum73.2%53.3%
Maximum99.4%100.0%
Range26.2%46.7%
Mean86.8%80.4%
Median87.8%81.1%
Interquartile 25% (IQ1)84.3%75.5%
Interquartile 75% (IQ3)89.5%85.8%
Interquartile Range (IQR)5.2%10.3%
Standard Deviation (Sample)4.9%8.6%
Standard Deviation (Population)4.9%8.5%

Similar Demographics by GED/Equivalency

Demographics Similar to Immigrants from Albania by GED/Equivalency

In terms of ged/equivalency, the demographic groups most similar to Immigrants from Albania are Alsatian (86.0%, a difference of 0.0%), Ethiopian (86.0%, a difference of 0.010%), Venezuelan (86.0%, a difference of 0.030%), Ugandan (86.1%, a difference of 0.050%), and Sierra Leonean (86.0%, a difference of 0.050%).
DemographicsRating | RankGED/Equivalency
Immigrants | Kenya
71.8
/100
|
#159
Good
86.2%
Immigrants | Morocco
69.5
/100
|
#160
Good
86.1%
Immigrants | Syria
69.3
/100
|
#161
Good
86.1%
Immigrants | Iraq
68.1
/100
|
#162
Good
86.1%
Ugandans
66.3
/100
|
#163
Good
86.1%
Venezuelans
65.5
/100
|
#164
Good
86.0%
Alsatians
64.3
/100
|
#165
Good
86.0%
Immigrants | Albania
64.2
/100
|
#166
Good
86.0%
Ethiopians
63.7
/100
|
#167
Good
86.0%
Sierra Leoneans
61.8
/100
|
#168
Good
86.0%
Immigrants | Ethiopia
61.2
/100
|
#169
Good
86.0%
Afghans
59.7
/100
|
#170
Average
85.9%
Immigrants | Chile
57.3
/100
|
#171
Average
85.9%
Bermudans
55.1
/100
|
#172
Average
85.8%
Immigrants | Venezuela
50.7
/100
|
#173
Average
85.8%

Demographics Similar to Navajo by GED/Equivalency

In terms of ged/equivalency, the demographic groups most similar to Navajo are Immigrants from Haiti (81.6%, a difference of 0.10%), Immigrants from Portugal (81.6%, a difference of 0.10%), Dutch West Indian (81.6%, a difference of 0.14%), Fijian (81.6%, a difference of 0.20%), and Immigrants from Grenada (81.3%, a difference of 0.21%).
DemographicsRating | RankGED/Equivalency
Immigrants | Bangladesh
0.0
/100
|
#297
Tragic
81.9%
Ute
0.0
/100
|
#298
Tragic
81.8%
Ecuadorians
0.0
/100
|
#299
Tragic
81.7%
Fijians
0.0
/100
|
#300
Tragic
81.6%
Dutch West Indians
0.0
/100
|
#301
Tragic
81.6%
Immigrants | Haiti
0.0
/100
|
#302
Tragic
81.6%
Immigrants | Portugal
0.0
/100
|
#303
Tragic
81.6%
Navajo
0.0
/100
|
#304
Tragic
81.5%
Immigrants | Grenada
0.0
/100
|
#305
Tragic
81.3%
Guyanese
0.0
/100
|
#306
Tragic
81.3%
Immigrants | Dominica
0.0
/100
|
#307
Tragic
81.1%
Puerto Ricans
0.0
/100
|
#308
Tragic
81.1%
Immigrants | Ecuador
0.0
/100
|
#309
Tragic
81.0%
Immigrants | Guyana
0.0
/100
|
#310
Tragic
81.0%
Natives/Alaskans
0.0
/100
|
#311
Tragic
80.9%