Immigrants from Albania vs Immigrants from Ethiopia Nursery School

COMPARE

Immigrants from Albania
Race
Ancestry
AfghanAfricanAlaska NativeAlaskan AthabascanAlbanianAleutAlsatianAmericanApacheArabArapahoArgentineanArmenianAssyrian/Chaldean/SyriacAustralianAustrianBahamianBangladeshiBarbadianBasqueBelgianBelizeanBermudanBhutaneseBlackfeetBolivianBrazilianBritishBritish West IndianBulgarianBurmeseCajunCambodianCanadianCape VerdeanCarpatho RusynCelticCentral AmericanCentral American IndianCherokeeCheyenneChickasawChileanChineseChippewaChoctawColombianColvilleComancheCosta RicanCreeCreekCroatianCrowCubanCypriotCzechCzechoslovakianDanishDelawareDominicanDutchDutch West IndianEastern EuropeanEcuadorianEgyptianEnglishEstonianEthiopianEuropeanFijianFilipinoFinnishFrenchFrench American IndianFrench CanadianGermanGerman RussianGhanaianGreekGuamanian/ChamorroGuatemalanGuyaneseHaitianHmongHonduranHopiHoumaHungarianIcelanderIndian (Asian)IndonesianInupiatIranianIraqiIrishIroquoisIsraeliItalianJamaicanJapaneseJordanianKenyanKiowaKoreanLaotianLatvianLebaneseLiberianLithuanianLumbeeLuxembourgerMacedonianMalaysianMalteseMarshalleseMenomineeMexicanMexican American IndianMongolianMoroccanNative HawaiianNavajoNepaleseNew ZealanderNicaraguanNigerianNorthern EuropeanNorwegianOkinawanOsageOttawaPaiutePakistaniPalestinianPanamanianParaguayanPennsylvania GermanPeruvianPimaPolishPortuguesePotawatomiPuebloPuerto RicanPuget Sound SalishRomanianRussianSalvadoranSamoanScandinavianScotch-IrishScottishSeminoleSenegaleseSerbianShoshoneSierra LeoneanSiouxSlavicSlovakSloveneSomaliSouth AfricanSouth AmericanSouth American IndianSoviet UnionSpaniardSpanishSpanish AmericanSpanish American IndianSri LankanSubsaharan AfricanSudaneseSwedishSwissSyrianTaiwaneseThaiTlingit-HaidaTohono O'OdhamTonganTrinidadian and TobagonianTsimshianTurkishU.S. Virgin IslanderUgandanUkrainianUruguayanUteVenezuelanVietnameseWelshWest IndianYakamaYaquiYugoslavianYumanYup'ikZimbabwean
Immigration
NonimmigrantsImmigrantsAfghanistanAfricaAlbaniaArgentinaArmeniaAsiaAustraliaAustriaBahamasBangladeshBarbadosBelarusBelgiumBelizeBoliviaBosnia and HerzegovinaBrazilBulgariaBurma/MyanmarCabo VerdeCambodiaCameroonCanadaCaribbeanCentral AmericaChileChinaColombiaCongoCosta RicaCroatiaCubaCzechoslovakiaDenmarkDominicaDominican RepublicEastern AfricaEastern AsiaEastern EuropeEcuadorEgyptEl SalvadorEnglandEritreaEuropeFijiFranceGermanyGhanaGreeceGrenadaGuatemalaGuyanaHaitiHondurasHong KongHungaryIndiaIndonesiaIranIraqIrelandIsraelItalyJamaicaJapanJordanKazakhstanKenyaKoreaKuwaitLaosLatin AmericaLatviaLebanonLiberiaLithuaniaMalaysiaMexicoMicronesiaMiddle AfricaMoldovaMoroccoNepalNetherlandsNicaraguaNigeriaNorth AmericaNorth MacedoniaNorthern AfricaNorthern EuropeNorwayOceaniaPakistanPanamaPeruPhilippinesPolandPortugalRomaniaRussiaSaudi ArabiaScotlandSenegalSerbiaSierra LeoneSingaporeSomaliaSouth AfricaSouth AmericaSouth Central AsiaSouth Eastern AsiaSouthern EuropeSpainSri LankaSt. Vincent and the GrenadinesSudanSwedenSwitzerlandSyriaTaiwanThailandTrinidad and TobagoTurkeyUgandaUkraineUruguayUzbekistanVenezuelaVietnamWest IndiesWestern AfricaWestern AsiaWestern EuropeYemenZaireZimbabweAzores
Immigrants from Ethiopia
Race
Ancestry
AfghanAfricanAlaska NativeAlaskan AthabascanAlbanianAleutAlsatianAmericanApacheArabArapahoArgentineanArmenianAssyrian/Chaldean/SyriacAustralianAustrianBahamianBangladeshiBarbadianBasqueBelgianBelizeanBermudanBhutaneseBlackfeetBolivianBrazilianBritishBritish West IndianBulgarianBurmeseCajunCambodianCanadianCape VerdeanCarpatho RusynCelticCentral AmericanCentral American IndianCherokeeCheyenneChickasawChileanChineseChippewaChoctawColombianColvilleComancheCosta RicanCreeCreekCroatianCrowCubanCypriotCzechCzechoslovakianDanishDelawareDominicanDutchDutch West IndianEastern EuropeanEcuadorianEgyptianEnglishEstonianEthiopianEuropeanFijianFilipinoFinnishFrenchFrench American IndianFrench CanadianGermanGerman RussianGhanaianGreekGuamanian/ChamorroGuatemalanGuyaneseHaitianHmongHonduranHopiHoumaHungarianIcelanderIndian (Asian)IndonesianInupiatIranianIraqiIrishIroquoisIsraeliItalianJamaicanJapaneseJordanianKenyanKiowaKoreanLaotianLatvianLebaneseLiberianLithuanianLumbeeLuxembourgerMacedonianMalaysianMalteseMarshalleseMenomineeMexicanMexican American IndianMongolianMoroccanNative HawaiianNavajoNepaleseNew ZealanderNicaraguanNigerianNorthern EuropeanNorwegianOkinawanOsageOttawaPaiutePakistaniPalestinianPanamanianParaguayanPennsylvania GermanPeruvianPimaPolishPortuguesePotawatomiPuebloPuerto RicanPuget Sound SalishRomanianRussianSalvadoranSamoanScandinavianScotch-IrishScottishSeminoleSenegaleseSerbianShoshoneSierra LeoneanSiouxSlavicSlovakSloveneSomaliSouth AfricanSouth AmericanSouth American IndianSoviet UnionSpaniardSpanishSpanish AmericanSpanish American IndianSri LankanSubsaharan AfricanSudaneseSwedishSwissSyrianTaiwaneseThaiTlingit-HaidaTohono O'OdhamTonganTrinidadian and TobagonianTsimshianTurkishU.S. Virgin IslanderUgandanUkrainianUruguayanUteVenezuelanVietnameseWelshWest IndianYakamaYaquiYugoslavianYumanYup'ikZimbabwean
Immigration
NonimmigrantsImmigrantsAfghanistanAfricaArgentinaArmeniaAsiaAustraliaAustriaBahamasBangladeshBarbadosBelarusBelgiumBelizeBoliviaBosnia and HerzegovinaBrazilBulgariaBurma/MyanmarCabo VerdeCambodiaCameroonCanadaCaribbeanCentral AmericaChileChinaColombiaCongoCosta RicaCroatiaCubaCzechoslovakiaDenmarkDominicaDominican RepublicEastern AfricaEastern AsiaEastern EuropeEcuadorEgyptEl SalvadorEnglandEritreaEthiopiaEuropeFijiFranceGermanyGhanaGreeceGrenadaGuatemalaGuyanaHaitiHondurasHong KongHungaryIndiaIndonesiaIranIraqIrelandIsraelItalyJamaicaJapanJordanKazakhstanKenyaKoreaKuwaitLaosLatin AmericaLatviaLebanonLiberiaLithuaniaMalaysiaMexicoMicronesiaMiddle AfricaMoldovaMoroccoNepalNetherlandsNicaraguaNigeriaNorth AmericaNorth MacedoniaNorthern AfricaNorthern EuropeNorwayOceaniaPakistanPanamaPeruPhilippinesPolandPortugalRomaniaRussiaSaudi ArabiaScotlandSenegalSerbiaSierra LeoneSingaporeSomaliaSouth AfricaSouth AmericaSouth Central AsiaSouth Eastern AsiaSouthern EuropeSpainSri LankaSt. Vincent and the GrenadinesSudanSwedenSwitzerlandSyriaTaiwanThailandTrinidad and TobagoTurkeyUgandaUkraineUruguayUzbekistanVenezuelaVietnamWest IndiesWestern AfricaWestern AsiaWestern EuropeYemenZaireZimbabweAzores
Nursery School
Income
Poverty
Unemployment
Labor Participation
Family Structure
Vehicle Availability
Education Level
Disability

Nursery School Comparison

Immigrants from Albania

Immigrants from Ethiopia

Poor
Tragic
97.9%
NURSERY SCHOOL
16.4/ 100
METRIC RATING
206th/ 347
METRIC RANK
97.6%
NURSERY SCHOOL
0.4/ 100
METRIC RATING
262nd/ 347
METRIC RANK

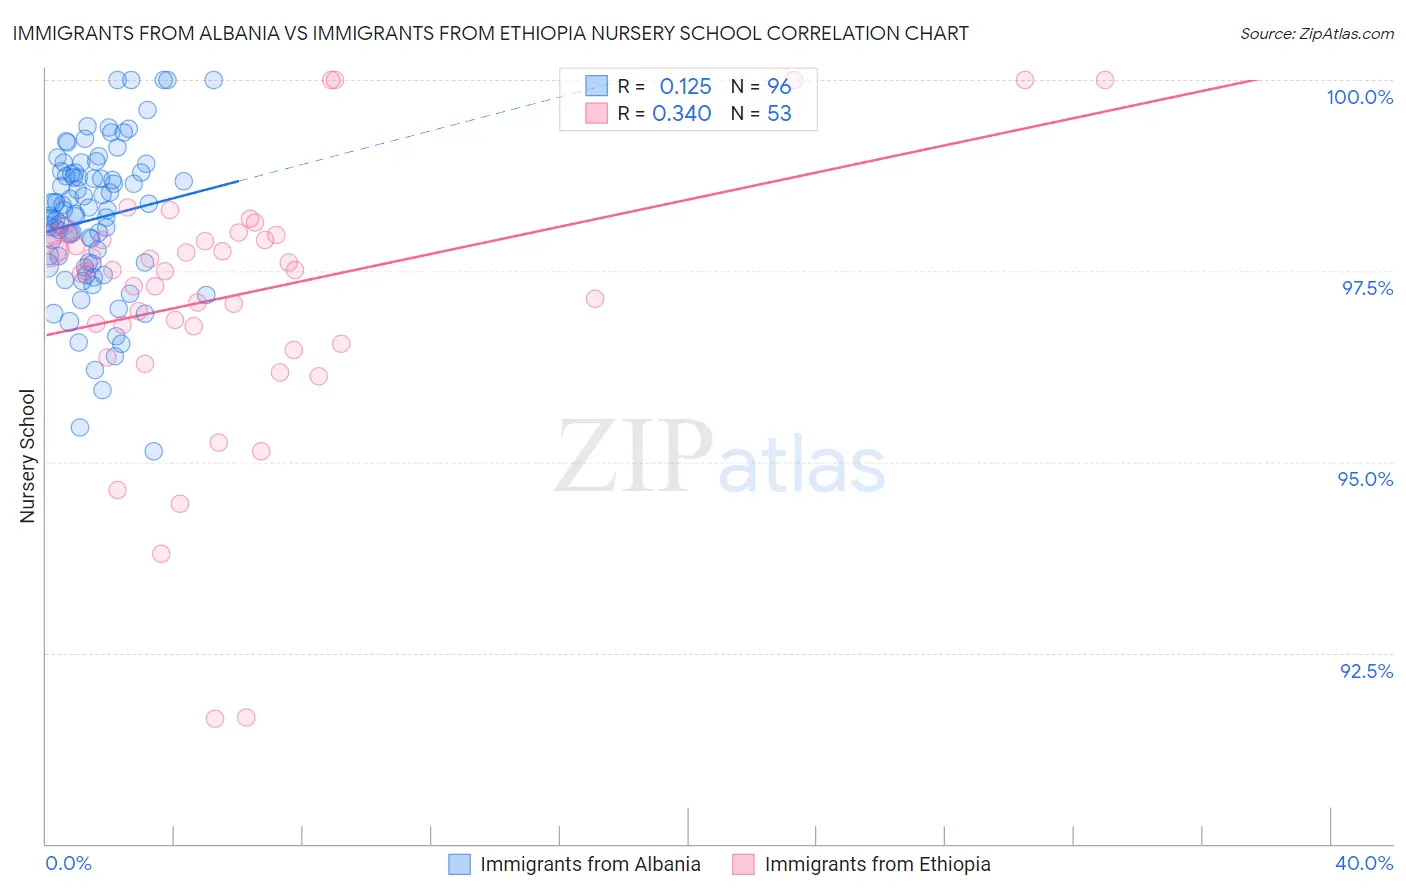
Immigrants from Albania vs Immigrants from Ethiopia Nursery School Correlation Chart

The statistical analysis conducted on geographies consisting of 119,263,578 people shows a poor positive correlation between the proportion of Immigrants from Albania and percentage of population with at least nursery school education in the United States with a correlation coefficient (R) of 0.125 and weighted average of 97.9%. Similarly, the statistical analysis conducted on geographies consisting of 211,539,400 people shows a mild positive correlation between the proportion of Immigrants from Ethiopia and percentage of population with at least nursery school education in the United States with a correlation coefficient (R) of 0.340 and weighted average of 97.6%, a difference of 0.30%.
Immigrants from Albania vs Immigrants from Ethiopia Nursery School

Nursery School Correlation Summary

MeasurementImmigrants from AlbaniaImmigrants from Ethiopia
Minimum95.1%91.6%
Maximum100.0%100.0%
Range4.9%8.4%
Mean98.2%97.2%
Median98.3%97.5%
Interquartile 25% (IQ1)97.6%96.7%
Interquartile 75% (IQ3)98.8%98.0%
Interquartile Range (IQR)1.2%1.3%
Standard Deviation (Sample)0.97%1.7%
Standard Deviation (Population)0.97%1.7%

Similar Demographics by Nursery School

Demographics Similar to Immigrants from Albania by Nursery School

In terms of nursery school, the demographic groups most similar to Immigrants from Albania are Immigrants from Chile (97.9%, a difference of 0.0%), Immigrants from Uganda (97.9%, a difference of 0.010%), Immigrants from Southern Europe (97.9%, a difference of 0.010%), African (97.9%, a difference of 0.010%), and Immigrants from Lebanon (97.9%, a difference of 0.020%).
DemographicsRating | RankNursery School
Immigrants | Egypt
22.5
/100
|
#199
Fair
97.9%
Tohono O'odham
22.2
/100
|
#200
Fair
97.9%
Immigrants | Lebanon
21.2
/100
|
#201
Fair
97.9%
Immigrants | Ukraine
19.9
/100
|
#202
Poor
97.9%
Immigrants | Uganda
18.0
/100
|
#203
Poor
97.9%
Immigrants | Southern Europe
17.4
/100
|
#204
Poor
97.9%
Immigrants | Chile
17.3
/100
|
#205
Poor
97.9%
Immigrants | Albania
16.4
/100
|
#206
Poor
97.9%
Africans
15.4
/100
|
#207
Poor
97.9%
Immigrants | Northern Africa
11.7
/100
|
#208
Poor
97.8%
Costa Ricans
11.3
/100
|
#209
Poor
97.8%
Immigrants | Oceania
10.2
/100
|
#210
Poor
97.8%
Laotians
9.8
/100
|
#211
Tragic
97.8%
Immigrants | Bahamas
8.6
/100
|
#212
Tragic
97.8%
Moroccans
8.3
/100
|
#213
Tragic
97.8%

Demographics Similar to Immigrants from Ethiopia by Nursery School

In terms of nursery school, the demographic groups most similar to Immigrants from Ethiopia are Fijian (97.6%, a difference of 0.0%), Armenian (97.6%, a difference of 0.010%), Immigrants from South America (97.6%, a difference of 0.010%), Cuban (97.6%, a difference of 0.010%), and Taiwanese (97.6%, a difference of 0.010%).
DemographicsRating | RankNursery School
Immigrants | Asia
0.7
/100
|
#255
Tragic
97.6%
Yaqui
0.6
/100
|
#256
Tragic
97.6%
Immigrants | Colombia
0.6
/100
|
#257
Tragic
97.6%
Jamaicans
0.6
/100
|
#258
Tragic
97.6%
Armenians
0.4
/100
|
#259
Tragic
97.6%
Immigrants | South America
0.4
/100
|
#260
Tragic
97.6%
Cubans
0.4
/100
|
#261
Tragic
97.6%
Immigrants | Ethiopia
0.4
/100
|
#262
Tragic
97.6%
Fijians
0.3
/100
|
#263
Tragic
97.6%
Taiwanese
0.3
/100
|
#264
Tragic
97.6%
Assyrians/Chaldeans/Syriacs
0.3
/100
|
#265
Tragic
97.6%
Immigrants | Sierra Leone
0.3
/100
|
#266
Tragic
97.6%
Immigrants | Nigeria
0.3
/100
|
#267
Tragic
97.5%
West Indians
0.3
/100
|
#268
Tragic
97.5%
Immigrants | Liberia
0.3
/100
|
#269
Tragic
97.5%