Immigrants from Africa vs Latvian Bachelor's Degree
COMPARE
Immigrants from Africa
Latvian
Bachelor's Degree
Bachelor's Degree Comparison
Immigrants from Africa
Latvians
38.9%
BACHELOR'S DEGREE
76.5/ 100
METRIC RATING
151st/ 347
METRIC RANK
46.1%
BACHELOR'S DEGREE
100.0/ 100
METRIC RATING
31st/ 347
METRIC RANK
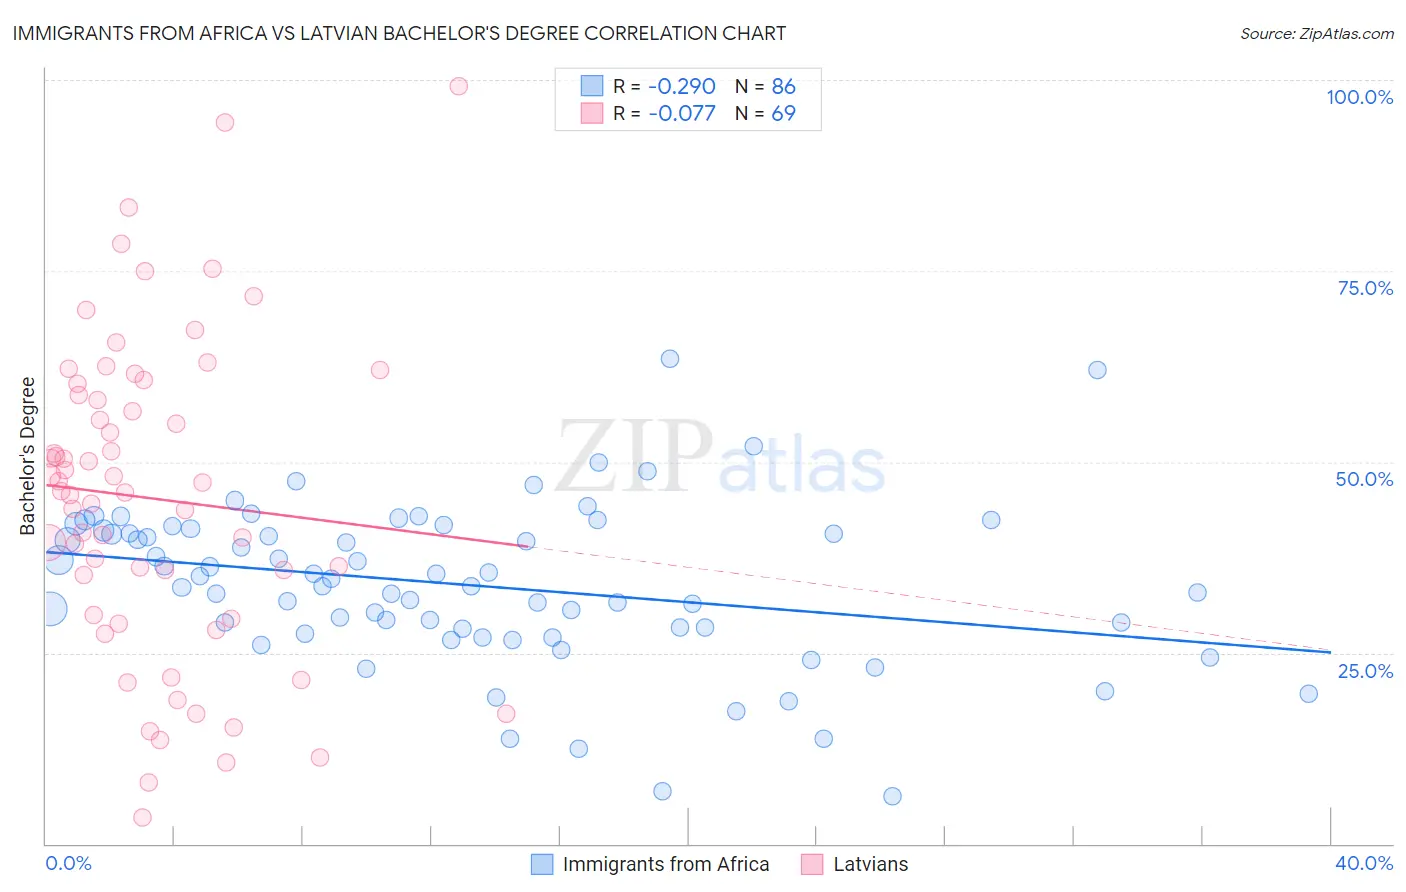
Immigrants from Africa vs Latvian Bachelor's Degree Correlation Chart
The statistical analysis conducted on geographies consisting of 469,379,940 people shows a weak negative correlation between the proportion of Immigrants from Africa and percentage of population with at least bachelor's degree education in the United States with a correlation coefficient (R) of -0.290 and weighted average of 38.9%. Similarly, the statistical analysis conducted on geographies consisting of 220,722,660 people shows a slight negative correlation between the proportion of Latvians and percentage of population with at least bachelor's degree education in the United States with a correlation coefficient (R) of -0.077 and weighted average of 46.1%, a difference of 18.4%.
Bachelor's Degree Correlation Summary
| Measurement | Immigrants from Africa | Latvian |
| Minimum | 6.2% | 3.4% |
| Maximum | 63.5% | 99.2% |
| Range | 57.3% | 95.8% |
| Mean | 33.9% | 45.2% |
| Median | 34.2% | 46.1% |
| Interquartile 25% (IQ1) | 28.2% | 29.7% |
| Interquartile 75% (IQ3) | 41.0% | 59.5% |
| Interquartile Range (IQR) | 12.9% | 29.8% |
| Standard Deviation (Sample) | 10.5% | 20.7% |
| Standard Deviation (Population) | 10.4% | 20.5% |
Similar Demographics by Bachelor's Degree
Demographics Similar to Immigrants from Africa by Bachelor's Degree
In terms of bachelor's degree, the demographic groups most similar to Immigrants from Africa are Sudanese (38.9%, a difference of 0.020%), Slavic (38.9%, a difference of 0.080%), South American (38.9%, a difference of 0.10%), Immigrants from Poland (39.0%, a difference of 0.13%), and Canadian (38.8%, a difference of 0.20%).
| Demographics | Rating | Rank | Bachelor's Degree |
| Immigrants | Afghanistan | 79.7 /100 | #144 | Good 39.1% |
| Slovenes | 79.5 /100 | #145 | Good 39.1% |
| Swedes | 79.2 /100 | #146 | Good 39.1% |
| Immigrants | Sierra Leone | 79.0 /100 | #147 | Good 39.0% |
| Iraqis | 78.1 /100 | #148 | Good 39.0% |
| Immigrants | Poland | 77.5 /100 | #149 | Good 39.0% |
| South Americans | 77.3 /100 | #150 | Good 38.9% |
| Immigrants | Africa | 76.5 /100 | #151 | Good 38.9% |
| Sudanese | 76.4 /100 | #152 | Good 38.9% |
| Slavs | 75.9 /100 | #153 | Good 38.9% |
| Canadians | 75.0 /100 | #154 | Good 38.8% |
| Immigrants | Kenya | 73.8 /100 | #155 | Good 38.8% |
| Kenyans | 72.5 /100 | #156 | Good 38.7% |
| Immigrants | South America | 70.1 /100 | #157 | Good 38.6% |
| Immigrants | Germany | 69.6 /100 | #158 | Good 38.6% |
Demographics Similar to Latvians by Bachelor's Degree
In terms of bachelor's degree, the demographic groups most similar to Latvians are Immigrants from Sri Lanka (46.1%, a difference of 0.040%), Israeli (46.1%, a difference of 0.090%), Turkish (46.2%, a difference of 0.22%), Immigrants from Turkey (46.0%, a difference of 0.30%), and Immigrants from France (46.4%, a difference of 0.68%).
| Demographics | Rating | Rank | Bachelor's Degree |
| Immigrants | Korea | 100.0 /100 | #24 | Exceptional 47.0% |
| Burmese | 100.0 /100 | #25 | Exceptional 46.9% |
| Immigrants | Japan | 100.0 /100 | #26 | Exceptional 46.8% |
| Immigrants | France | 100.0 /100 | #27 | Exceptional 46.4% |
| Turks | 100.0 /100 | #28 | Exceptional 46.2% |
| Israelis | 100.0 /100 | #29 | Exceptional 46.1% |
| Immigrants | Sri Lanka | 100.0 /100 | #30 | Exceptional 46.1% |
| Latvians | 100.0 /100 | #31 | Exceptional 46.1% |
| Immigrants | Turkey | 100.0 /100 | #32 | Exceptional 46.0% |
| Immigrants | Northern Europe | 100.0 /100 | #33 | Exceptional 45.6% |
| Immigrants | Denmark | 100.0 /100 | #34 | Exceptional 45.4% |
| Immigrants | Russia | 100.0 /100 | #35 | Exceptional 45.4% |
| Mongolians | 100.0 /100 | #36 | Exceptional 45.4% |
| Russians | 100.0 /100 | #37 | Exceptional 45.3% |
| Bulgarians | 100.0 /100 | #38 | Exceptional 45.3% |