Icelander vs West Indian 8th Grade
COMPARE
Icelander
West Indian
8th Grade
8th Grade Comparison
Icelanders
West Indians
96.5%
8TH GRADE
99.2/ 100
METRIC RATING
83rd/ 347
METRIC RANK
94.8%
8TH GRADE
0.3/ 100
METRIC RATING
266th/ 347
METRIC RANK
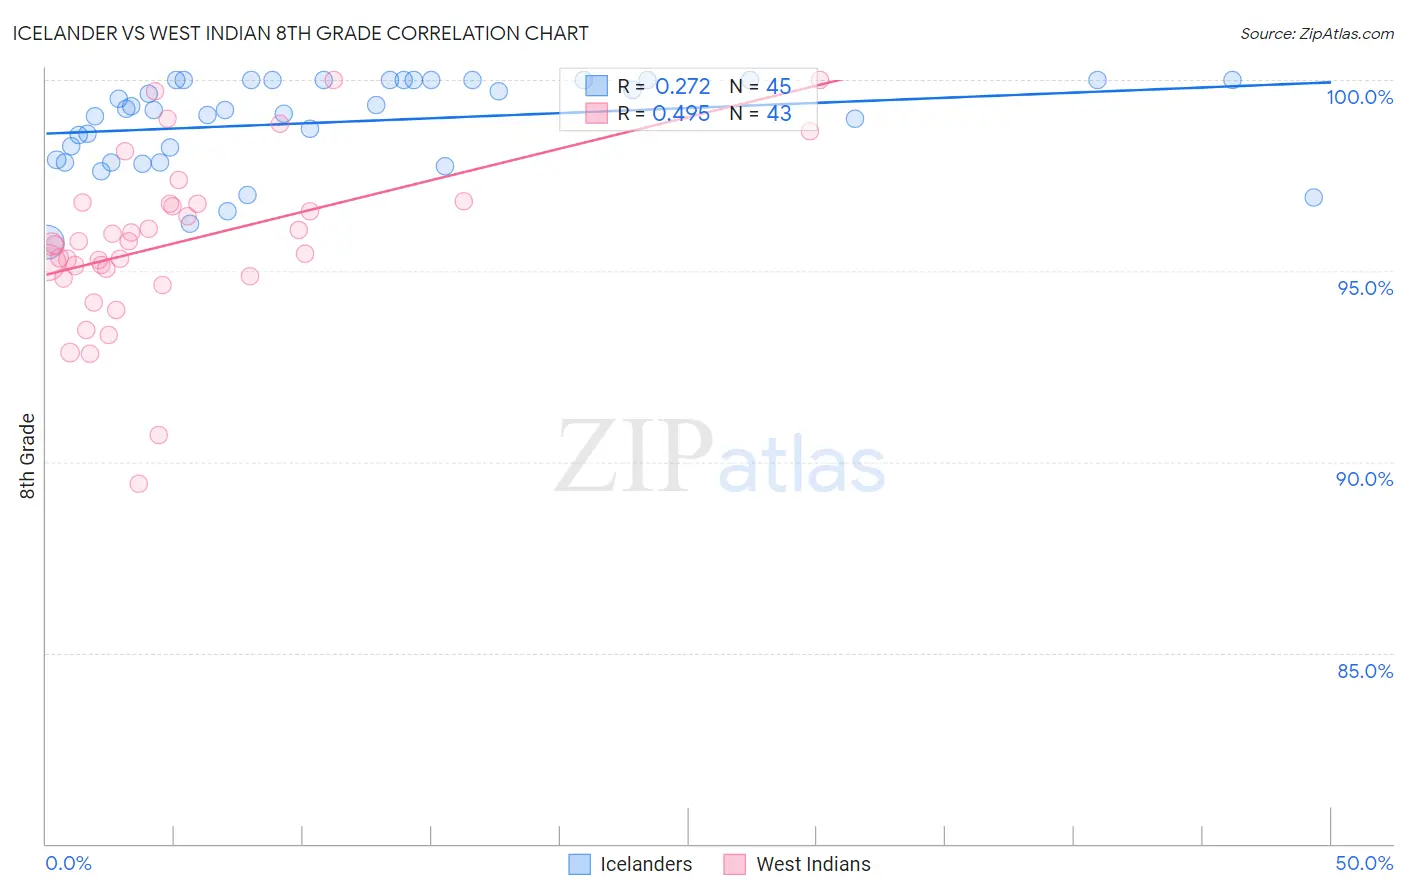
Icelander vs West Indian 8th Grade Correlation Chart
The statistical analysis conducted on geographies consisting of 159,668,915 people shows a weak positive correlation between the proportion of Icelanders and percentage of population with at least 8th grade education in the United States with a correlation coefficient (R) of 0.272 and weighted average of 96.5%. Similarly, the statistical analysis conducted on geographies consisting of 254,059,006 people shows a moderate positive correlation between the proportion of West Indians and percentage of population with at least 8th grade education in the United States with a correlation coefficient (R) of 0.495 and weighted average of 94.8%, a difference of 1.7%.
8th Grade Correlation Summary
| Measurement | Icelander | West Indian |
| Minimum | 95.8% | 89.4% |
| Maximum | 100.0% | 100.0% |
| Range | 4.2% | 10.6% |
| Mean | 98.9% | 95.8% |
| Median | 99.2% | 95.7% |
| Interquartile 25% (IQ1) | 97.9% | 94.9% |
| Interquartile 75% (IQ3) | 100.0% | 96.8% |
| Interquartile Range (IQR) | 2.1% | 1.9% |
| Standard Deviation (Sample) | 1.2% | 2.2% |
| Standard Deviation (Population) | 1.2% | 2.2% |
Similar Demographics by 8th Grade
Demographics Similar to Icelanders by 8th Grade
In terms of 8th grade, the demographic groups most similar to Icelanders are Delaware (96.5%, a difference of 0.010%), Romanian (96.5%, a difference of 0.010%), Turkish (96.5%, a difference of 0.010%), Immigrants from Belgium (96.5%, a difference of 0.010%), and Immigrants from South Africa (96.5%, a difference of 0.020%).
| Demographics | Rating | Rank | 8th Grade |
| Immigrants | Netherlands | 99.4 /100 | #76 | Exceptional 96.5% |
| Cypriots | 99.4 /100 | #77 | Exceptional 96.5% |
| Yugoslavians | 99.4 /100 | #78 | Exceptional 96.5% |
| Puget Sound Salish | 99.3 /100 | #79 | Exceptional 96.5% |
| Delaware | 99.2 /100 | #80 | Exceptional 96.5% |
| Romanians | 99.2 /100 | #81 | Exceptional 96.5% |
| Turks | 99.2 /100 | #82 | Exceptional 96.5% |
| Icelanders | 99.2 /100 | #83 | Exceptional 96.5% |
| Immigrants | Belgium | 99.1 /100 | #84 | Exceptional 96.5% |
| Immigrants | South Africa | 99.1 /100 | #85 | Exceptional 96.5% |
| Cherokee | 99.0 /100 | #86 | Exceptional 96.5% |
| Immigrants | Australia | 99.0 /100 | #87 | Exceptional 96.5% |
| Immigrants | Western Europe | 99.0 /100 | #88 | Exceptional 96.4% |
| Chickasaw | 98.9 /100 | #89 | Exceptional 96.4% |
| Immigrants | Sweden | 98.9 /100 | #90 | Exceptional 96.4% |
Demographics Similar to West Indians by 8th Grade
In terms of 8th grade, the demographic groups most similar to West Indians are Immigrants from Ghana (94.8%, a difference of 0.010%), Immigrants from Uruguay (94.8%, a difference of 0.020%), Yuman (94.9%, a difference of 0.040%), Immigrants from Thailand (94.8%, a difference of 0.040%), and Immigrants from Hong Kong (94.9%, a difference of 0.050%).
| Demographics | Rating | Rank | 8th Grade |
| Ghanaians | 0.6 /100 | #259 | Tragic 94.9% |
| Immigrants | Jamaica | 0.6 /100 | #260 | Tragic 94.9% |
| Immigrants | Costa Rica | 0.5 /100 | #261 | Tragic 94.9% |
| Immigrants | Nigeria | 0.4 /100 | #262 | Tragic 94.9% |
| Immigrants | Hong Kong | 0.4 /100 | #263 | Tragic 94.9% |
| South Americans | 0.4 /100 | #264 | Tragic 94.9% |
| Yuman | 0.4 /100 | #265 | Tragic 94.9% |
| West Indians | 0.3 /100 | #266 | Tragic 94.8% |
| Immigrants | Ghana | 0.3 /100 | #267 | Tragic 94.8% |
| Immigrants | Uruguay | 0.3 /100 | #268 | Tragic 94.8% |
| Immigrants | Thailand | 0.2 /100 | #269 | Tragic 94.8% |
| Immigrants | Uzbekistan | 0.2 /100 | #270 | Tragic 94.8% |
| Immigrants | Afghanistan | 0.2 /100 | #271 | Tragic 94.8% |
| Immigrants | South America | 0.2 /100 | #272 | Tragic 94.8% |
| Immigrants | Western Africa | 0.2 /100 | #273 | Tragic 94.8% |