Icelander vs Brazilian 11th Grade
COMPARE
Icelander
Brazilian
11th Grade
11th Grade Comparison
Icelanders
Brazilians
93.6%
11TH GRADE
99.3/ 100
METRIC RATING
83rd/ 347
METRIC RANK
92.8%
11TH GRADE
73.9/ 100
METRIC RATING
153rd/ 347
METRIC RANK
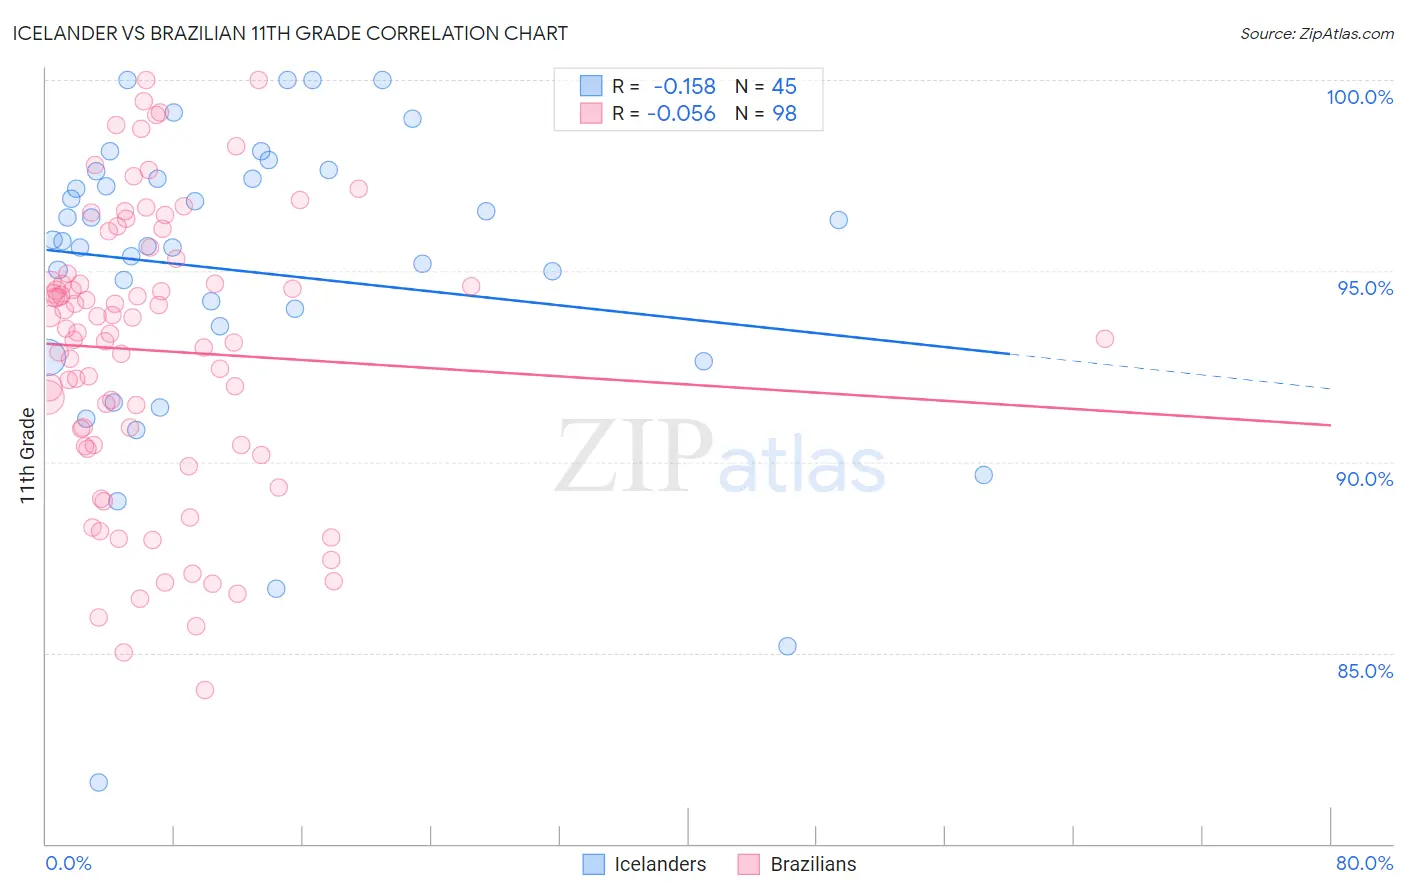
Icelander vs Brazilian 11th Grade Correlation Chart
The statistical analysis conducted on geographies consisting of 159,668,816 people shows a poor negative correlation between the proportion of Icelanders and percentage of population with at least 11th grade education in the United States with a correlation coefficient (R) of -0.158 and weighted average of 93.6%. Similarly, the statistical analysis conducted on geographies consisting of 323,900,771 people shows a slight negative correlation between the proportion of Brazilians and percentage of population with at least 11th grade education in the United States with a correlation coefficient (R) of -0.056 and weighted average of 92.8%, a difference of 0.95%.
11th Grade Correlation Summary
| Measurement | Icelander | Brazilian |
| Minimum | 81.6% | 84.0% |
| Maximum | 100.0% | 100.0% |
| Range | 18.4% | 16.0% |
| Mean | 95.0% | 92.9% |
| Median | 95.8% | 93.4% |
| Interquartile 25% (IQ1) | 93.1% | 90.4% |
| Interquartile 75% (IQ3) | 97.5% | 94.9% |
| Interquartile Range (IQR) | 4.4% | 4.5% |
| Standard Deviation (Sample) | 4.0% | 3.7% |
| Standard Deviation (Population) | 3.9% | 3.7% |
Similar Demographics by 11th Grade
Demographics Similar to Icelanders by 11th Grade
In terms of 11th grade, the demographic groups most similar to Icelanders are Immigrants from Taiwan (93.6%, a difference of 0.0%), Immigrants from Saudi Arabia (93.7%, a difference of 0.010%), Immigrants from Switzerland (93.6%, a difference of 0.010%), Immigrants from South Central Asia (93.6%, a difference of 0.010%), and Immigrants from Western Europe (93.6%, a difference of 0.020%).
| Demographics | Rating | Rank | 11th Grade |
| Celtics | 99.5 /100 | #76 | Exceptional 93.7% |
| Aleuts | 99.5 /100 | #77 | Exceptional 93.7% |
| Soviet Union | 99.5 /100 | #78 | Exceptional 93.7% |
| Immigrants | Denmark | 99.5 /100 | #79 | Exceptional 93.7% |
| Canadians | 99.5 /100 | #80 | Exceptional 93.7% |
| Immigrants | Moldova | 99.5 /100 | #81 | Exceptional 93.7% |
| Immigrants | Saudi Arabia | 99.3 /100 | #82 | Exceptional 93.7% |
| Icelanders | 99.3 /100 | #83 | Exceptional 93.6% |
| Immigrants | Taiwan | 99.3 /100 | #84 | Exceptional 93.6% |
| Immigrants | Switzerland | 99.3 /100 | #85 | Exceptional 93.6% |
| Immigrants | South Central Asia | 99.2 /100 | #86 | Exceptional 93.6% |
| Immigrants | Western Europe | 99.2 /100 | #87 | Exceptional 93.6% |
| Cambodians | 99.2 /100 | #88 | Exceptional 93.6% |
| Burmese | 99.2 /100 | #89 | Exceptional 93.6% |
| Ottawa | 99.2 /100 | #90 | Exceptional 93.6% |
Demographics Similar to Brazilians by 11th Grade
In terms of 11th grade, the demographic groups most similar to Brazilians are Potawatomi (92.8%, a difference of 0.0%), Iraqi (92.8%, a difference of 0.0%), Osage (92.7%, a difference of 0.010%), Argentinean (92.7%, a difference of 0.010%), and Immigrants from Spain (92.7%, a difference of 0.010%).
| Demographics | Rating | Rank | 11th Grade |
| Iroquois | 79.1 /100 | #146 | Good 92.8% |
| Immigrants | Kenya | 78.7 /100 | #147 | Good 92.8% |
| Hmong | 78.6 /100 | #148 | Good 92.8% |
| Immigrants | Poland | 78.5 /100 | #149 | Good 92.8% |
| Immigrants | Egypt | 77.5 /100 | #150 | Good 92.8% |
| Potawatomi | 74.3 /100 | #151 | Good 92.8% |
| Iraqis | 74.2 /100 | #152 | Good 92.8% |
| Brazilians | 73.9 /100 | #153 | Good 92.8% |
| Osage | 73.4 /100 | #154 | Good 92.7% |
| Argentineans | 73.4 /100 | #155 | Good 92.7% |
| Immigrants | Spain | 73.0 /100 | #156 | Good 92.7% |
| Immigrants | Eastern Asia | 72.6 /100 | #157 | Good 92.7% |
| Immigrants | Venezuela | 72.0 /100 | #158 | Good 92.7% |
| Americans | 71.7 /100 | #159 | Good 92.7% |
| Immigrants | Lebanon | 70.7 /100 | #160 | Good 92.7% |